All official European Union website addresses are in the europa.eu domain.
See all EU institutions and bodiesAn official website of the European Union | How do you know?
Environmental information systems
EN
- БългарскиBG
- češtinaCS
- HrvatskiHR
- danskDA
- NederlandsNL
- ελληνικάEL
- EnglishEN
- eestiET
- SuomiFI
- FrançaisFR
- DeutschDE
- magyarHU
- ÍslenskaIS
- italianoIT
- LatviešuLV
- lietuviųLT
- MaltiMT
- NorskNO
- polskiPL
- PortuguêsPT
- RomânăRO
- slovenčinaSK
- SlovenščinaSL
- EspañolES
- SvenskaSV
- TürkçeTR
Elasticity of transport demand with respect to fuel price
Chart (static)
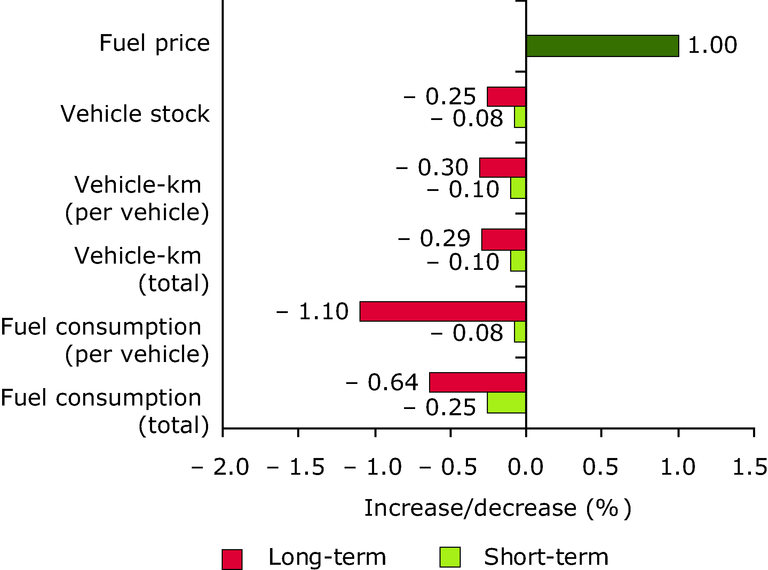
Economic elasticity is the proportional change in one variable relative to the proportional change in another

Downloads
Data sources
Metadata
More info
Loading
For instance, a 1 % increase in fuel price leads to a 0.1 % short-term decrease in vehicle-km. The long-term decrease is higher, namely 0.3 % per vehicle or 0.29 % in total. With a constant or declining occupancy rate, the transport volume in terms of passenger-km decreases at the same rate or faster, respectively. This means that the transport volume from 1990 to 2002, as depicted in the figure above (with the development of fuel prices), would have grown even faster if the fuel prices had stayed at a constant level.