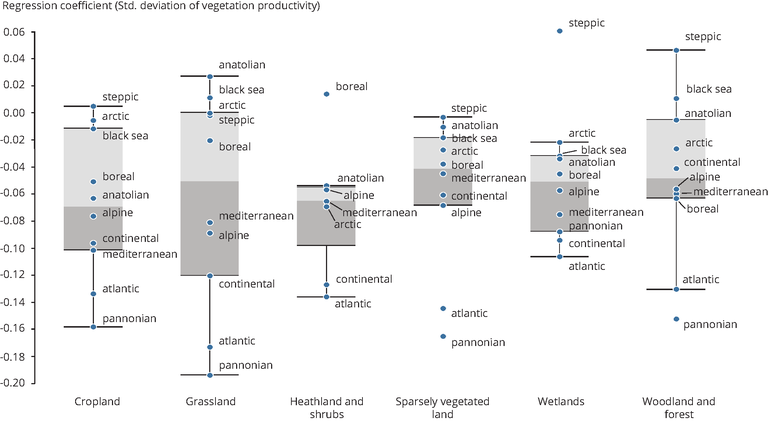
Productivity time series 2000-2016 (one value per year) over pixels with significant (p < 0.1) productivity trends were regressed against a time series of the number of frost days, 2000-2016, yearly sums. Using the Corine Land Cover (CLC) 2000-2018 series, only those grid cells were considered in this analysis where the CLC layers indicated no land use change between 2000-2018.
The dependent productivity variable and the explanatory variable of frosty days frequency were normalised and detrended before the regression runs. Significance of the regression coefficient was measured as p < 0.1. Due to standardizing all variables results are presented in standardized regression coefficients that show the change in the dependent variable measured in standard deviations.