All official European Union website addresses are in the europa.eu domain.
See all EU institutions and bodiesAn official website of the European Union | How do you know?
Environmental information systems
EN
- БългарскиBG
- češtinaCS
- HrvatskiHR
- danskDA
- NederlandsNL
- ελληνικάEL
- EnglishEN
- eestiET
- SuomiFI
- FrançaisFR
- DeutschDE
- magyarHU
- ÍslenskaIS
- italianoIT
- LatviešuLV
- lietuviųLT
- MaltiMT
- NorskNO
- polskiPL
- PortuguêsPT
- RomânăRO
- slovenčinaSK
- SlovenščinaSL
- EspañolES
- SvenskaSV
- TürkçeTR
Circular material use rate under different exploratory scenarios.
Chart (static)
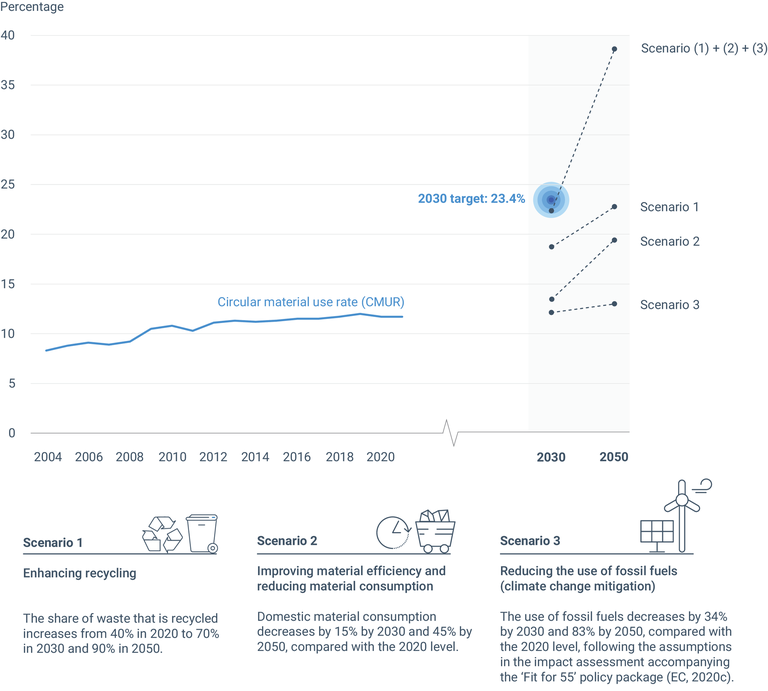
The analysis of the changes to waste and material flows provides only a first indicative estimate of how the CMUR might change (assuming other parameters remain constant), without implementing a full mass-balancing exercise. The effect of selected (isolated) variations in the underlying parameters of the CMUR indicator should be interpreted as exploratory scenario results.
Downloads
Data sources
Metadata
More info
Loading
- Developed by the EEA and the European Topic Centre on Circular Economy and Resource Use (ETC CE). A more detailed description of the scenarios and how they are modelled is available in ETC CE (2023). CMUR trend 2004-2021: Eurostat (2023a).
Additional information
The analysis of the changes to waste and material flows only provides a first indicative estimate of how the CMUR might change (assuming other parameters remain constant), without implementing a full mass-balancing exercise. The effect of selected (isolated) variations in the underlying parameters of the CMUR indicator should be interpreted as exploratory scenario results.