All official European Union website addresses are in the europa.eu domain.
See all EU institutions and bodies
An official website of the European Union | How do you know?
Environmental information systems
EN

- БългарскиBG
- češtinaCS
- HrvatskiHR
- danskDA
- NederlandsNL
- ελληνικάEL
- EnglishEN
- eestiET
- SuomiFI
- FrançaisFR
- DeutschDE
- magyarHU
- ÍslenskaIS
- italianoIT
- LatviešuLV
- lietuviųLT
- MaltiMT
- NorskNO
- polskiPL
- PortuguêsPT
- RomânăRO
- slovenčinaSK
- SlovenščinaSL
- EspañolES
- SvenskaSV
- TürkçeTR
Average concentration of nitrate in European rivers
Chart (static)
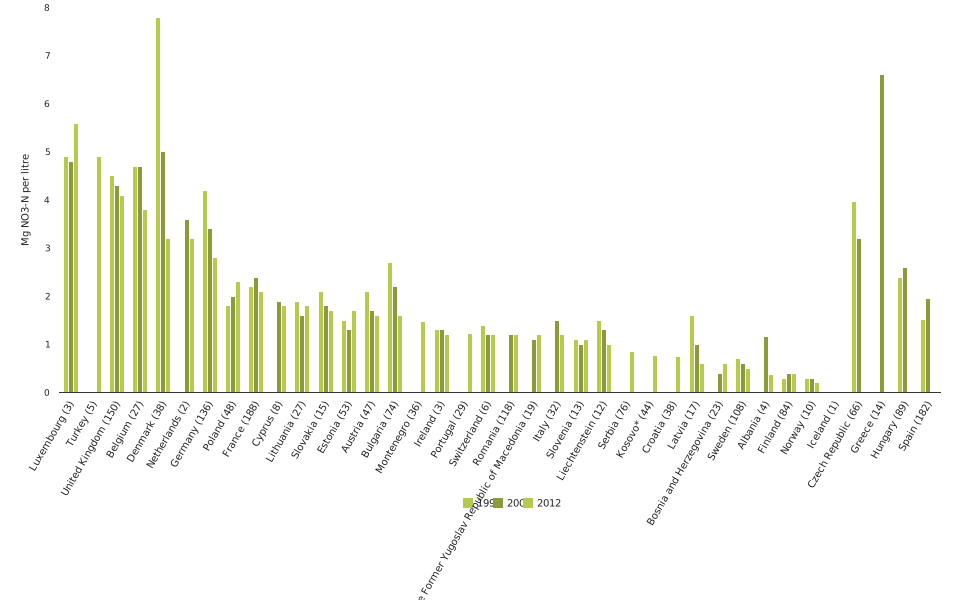
Note: The following countries were not included in any trend analysis due to a lack of comparable data (available time series is indicated in brackets): Croatia (2003–2012); Czech Republic (1992–2008); Greece (2000–2007); Hungary (1992–2006); Kosovo* (2008–2012); Malta (no river data reported); Montenegro (2010–2012); Spain (1992–2008) and Turkey (2005–2012). *Kosovo under UNSCR 1244/99. NO3-N is nitrate as nitrogen.
Downloads
Data sources
Metadata
More info
- Waterbase - Rivers, European Environment Agency (EEA)
, Albania, Austria, Belgium, Bosnia and Herzegovina, Bulgaria, Croatia, Cyprus, Czechia, Denmark, Estonia, Finland, France, Germany, Ireland, Kosovo (UNSCR 1244/99), Latvia, Lithuania, Luxembourg, Poland, Portugal, Romania, Serbia, Slovakia, Slovenia, Spain, Sweden, North Macedonia, Turkey, United Kingdom
1992
2000
2012