All official European Union website addresses are in the europa.eu domain.
See all EU institutions and bodies
An official website of the European Union | How do you know?
Environmental information systems
EN

- БългарскиBG
- češtinaCS
- HrvatskiHR
- danskDA
- NederlandsNL
- ελληνικάEL
- EnglishEN
- eestiET
- SuomiFI
- FrançaisFR
- DeutschDE
- magyarHU
- ÍslenskaIS
- italianoIT
- LatviešuLV
- lietuviųLT
- MaltiMT
- NorskNO
- polskiPL
- PortuguêsPT
- RomânăRO
- slovenčinaSK
- SlovenščinaSL
- EspañolES
- SvenskaSV
- TürkçeTR
Aquaculture production per country and environment in 2012
Chart (static)
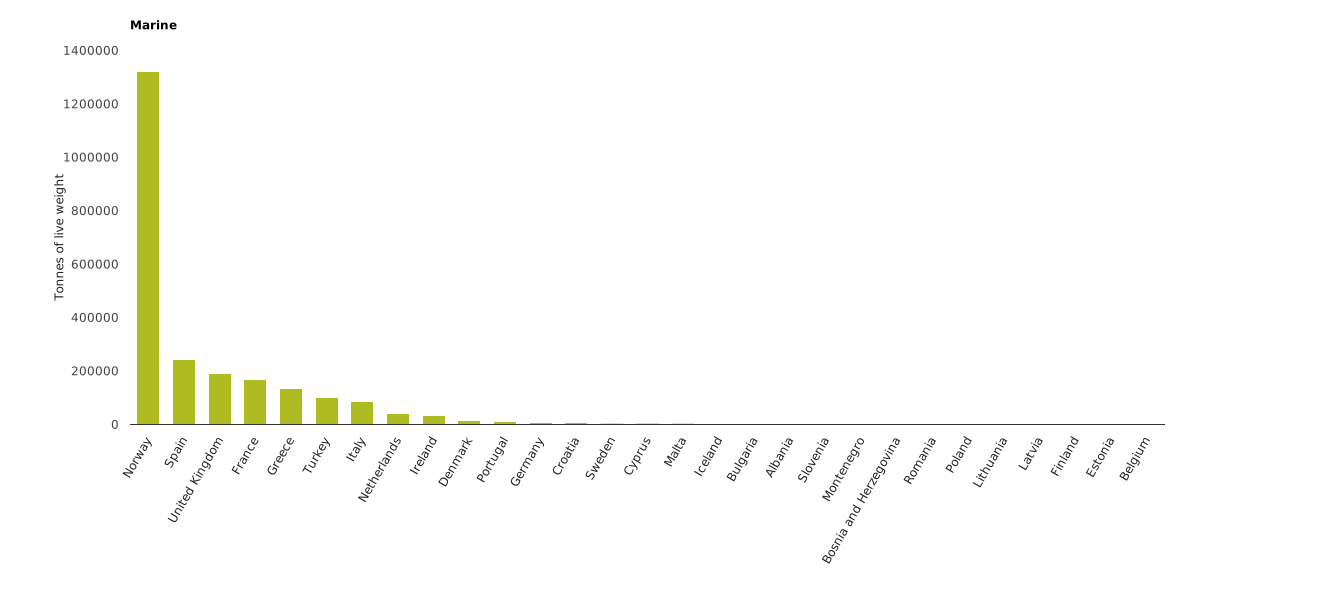
Note: This figure shows the status of aquaculture production (tonnes) by country in 2012. Production is broken down by marine, brackish and freshwater environments. Data are shown for the EU-28 and non-EU countries that are part of the EEA Eionet network. Only countries with a coastline are shown in the charts for marine and brackish environments.
Downloads
Data sources
Metadata
More info
- Annual aquaculture production by major environment across Europe, Food and Agriculture Organization of the United Nations (FAO)
Albania, Austria, Belgium, Bosnia and Herzegovina, Bulgaria, Cyprus, Czechia, Denmark, Estonia, Finland, France, Germany, Greece, Hungary, Iceland, Ireland, Italy, Latvia, Lithuania, Malta, Montenegro, Netherlands, Norway, Poland, Portugal, Romania, Serbia, Slovakia, Slovenia, Spain, Sweden, Switzerland, North Macedonia, Turkey, United Kingdom
2012