All official European Union website addresses are in the europa.eu domain.
See all EU institutions and bodies- БългарскиBG
- češtinaCS
- HrvatskiHR
- danskDA
- NederlandsNL
- ελληνικάEL
- EnglishEN
- eestiET
- SuomiFI
- FrançaisFR
- DeutschDE
- magyarHU
- ÍslenskaIS
- italianoIT
- LatviešuLV
- lietuviųLT
- MaltiMT
- NorskNO
- polskiPL
- PortuguêsPT
- RomânăRO
- slovenčinaSK
- SlovenščinaSL
- EspañolES
- SvenskaSV
- TürkçeTR
Annual mean benzene concentrations
Map (static)
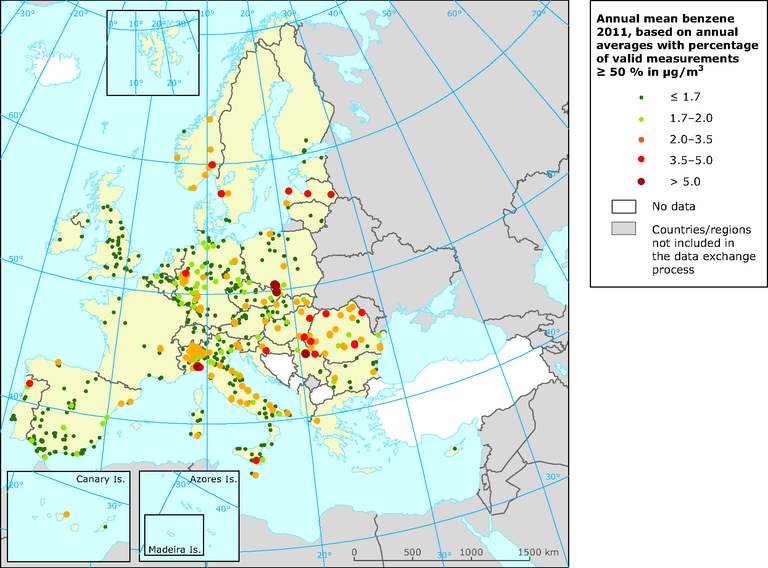
The map shows the annual mean benzene concentrations in 2011, based on annual averages with percentage of valid measurements >= 50% in μg/m3
Additional information
Dark green dots correspond to concentrations under the WHO reference level (1.7 μg/m3).
Pale green dots correspond to concentrations under the lower assessment threshold (2 μg/m3).
Orange dots correspond to concentrations between the lower and the upper assessment threshold (3.5 μg/m3).
Red dots correspond to concentrations under the limit value of 5 μg/m3 but higher than the upper assessment threshold.
Dark red dots correspond to concentrations exceeding the limit value of 5 μg/m3.
The data coverage criterion has been set to 50 % by an European Commission working group on benzene (Mol et al., 2011).