All official European Union website addresses are in the europa.eu domain.
See all EU institutions and bodiesAn official website of the European Union | How do you know?
Environmental information systems
EN
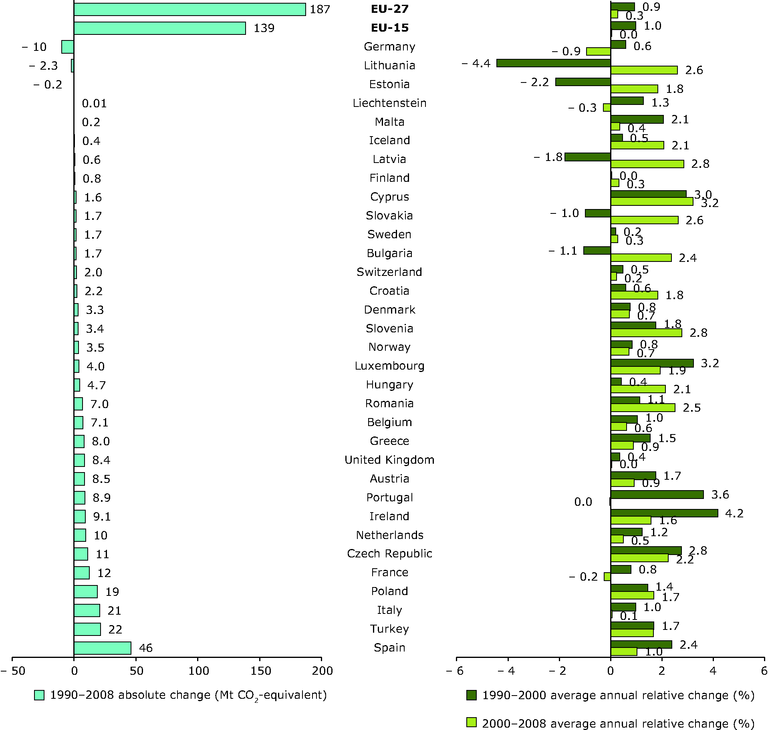
Countries sorted according to absolute change between 1990 and 2008. Average annual relative change (%) = (last year/base year)(1/number of years) – 1.
Loading