All official European Union website addresses are in the europa.eu domain.
See all EU institutions and bodies
An official website of the European Union | How do you know?
Environmental information systems
EN

- БългарскиBG
- češtinaCS
- HrvatskiHR
- danskDA
- NederlandsNL
- ελληνικάEL
- EnglishEN
- eestiET
- SuomiFI
- FrançaisFR
- DeutschDE
- magyarHU
- ÍslenskaIS
- italianoIT
- LatviešuLV
- lietuviųLT
- MaltiMT
- NorskNO
- polskiPL
- PortuguêsPT
- RomânăRO
- slovenčinaSK
- SlovenščinaSL
- EspañolES
- SvenskaSV
- TürkçeTR
Total waste and plastic packaging waste generation versus GDP in EU-27
Chart (static)
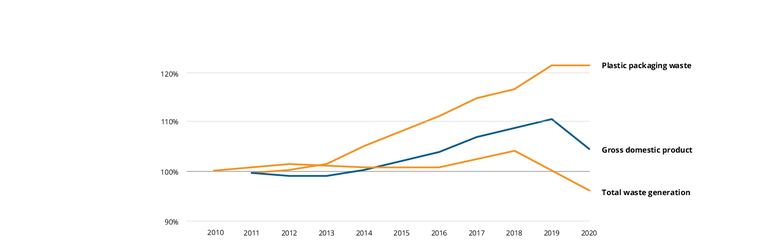
Waste generation and decoupling in the 27 EU Member States (EU-27) between 2010 and 2020 (EEA, 2021) and plastic packaging waste generated per person in the EU-27 between 2011 and 2020.
Downloads
Data sources
Metadata
More info
Loading
- Austria
- Belgium
- Bulgaria
- Croatia
- Cyprus
- Czechia
- Denmark
- Estonia
- Finland
- France
- Germany
- Greece
- Hungary
- Ireland
- Italy
- Latvia
- Lithuania
- Luxembourg
- Malta
- Netherlands
- Poland
- Portugal
- Romania
- Slovakia
- Slovenia
- Spain
- Sweden
2011-2020
Methodology
For more details on the methodology, see report Marine Litter in Europe - An integrated assessment from source to sea (https://forum.eionet.europa.eu/etc-icm-consortium/library/subvention-2022/tasks-and-milestones-2022/1.1.8.1-marine-litter-assessment/milestone-2-addressing-comments-eea-and-finalization-assessment-report/final-version-november-2022-eea-approval/etc-icm_marine-litter-assessment_master_v5.2_06112022_for-eea-approval)