All official European Union website addresses are in the europa.eu domain.
See all EU institutions and bodiesAn official website of the European Union | How do you know?
Environmental information systems
EN
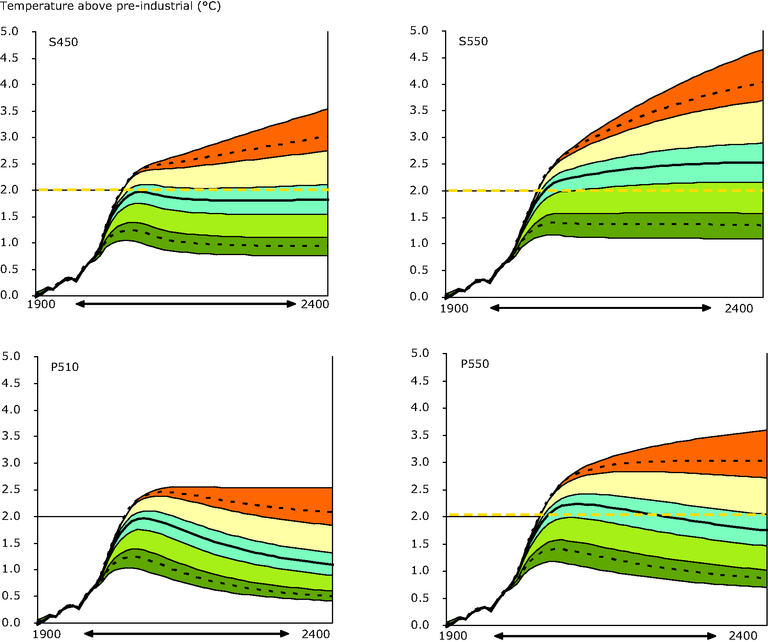
Above preindustrial levels for pathways stabilising at 450 and 550 ppm CO2equivalent concentration levels (upper row) and the pathways that peak at 510 and 550 ppm respectively (lower row)
Loading