All official European Union website addresses are in the europa.eu domain.
See all EU institutions and bodiesAn official website of the European Union | How do you know?
Environmental information systems
EN
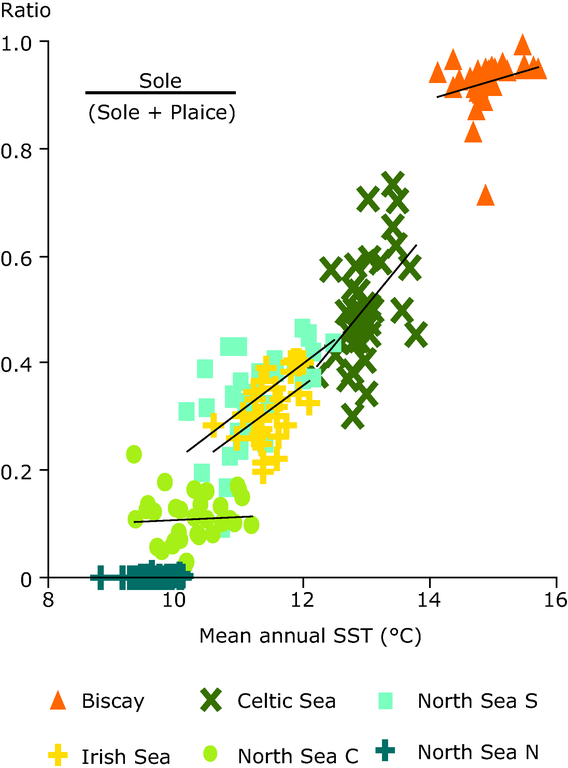
Data are shown for four different seas and three sections of the North Sea,
depending on mean annual SST
Loading