All official European Union website addresses are in the europa.eu domain.
See all EU institutions and bodiesAn official website of the European Union | How do you know?
Environmental information systems
EN
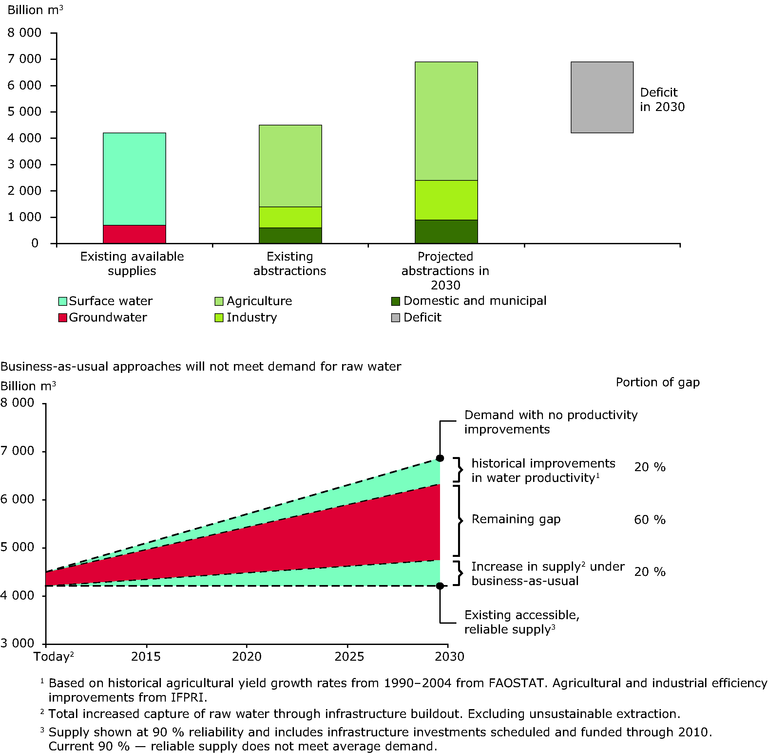
A report by the 2030 Water Resource Group estimates the global demand for water in 2030 and compare it with projections of increasing water supply and reducing demand.
Loading