All official European Union website addresses are in the europa.eu domain.
See all EU institutions and bodiesAn official website of the European Union | How do you know?
Environmental information systems
EN
- БългарскиBG
- češtinaCS
- HrvatskiHR
- danskDA
- NederlandsNL
- ελληνικάEL
- EnglishEN
- eestiET
- SuomiFI
- FrançaisFR
- DeutschDE
- magyarHU
- ÍslenskaIS
- italianoIT
- LatviešuLV
- lietuviųLT
- MaltiMT
- NorskNO
- polskiPL
- PortuguêsPT
- RomânăRO
- slovenčinaSK
- SlovenščinaSL
- EspañolES
- SvenskaSV
- TürkçeTR
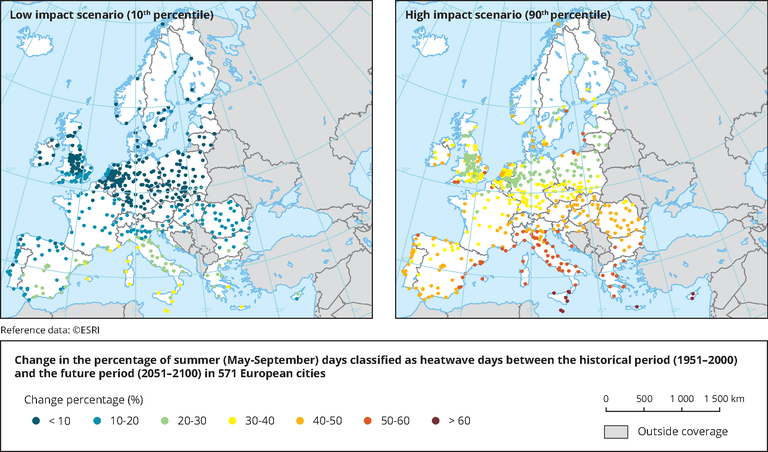
Change in the percentage of summer (May-September) days classified as heatwave days between the historical period (1951–2000) and the future period (2051–2100) in 571 European cities.
Map (static)
The map presents the projected change in days classificed in heatwave days
Downloads
Data sources
Metadata
More info
Loading
- Austria
- Belgium
- Bulgaria
- Croatia
- Cyprus
- Czechia
- Denmark
- Estonia
- Finland
- France
- Germany
- Greece
- Hungary
- Iceland
- Ireland
- Italy
- Latvia
- Lithuania
- Luxembourg
- Malta
- Netherlands
- Norway
- Poland
- Portugal
- Romania
- Slovakia
- Slovenia
- Spain
- Sweden
- Switzerland
- United Kingdom
1951-2000
2051-2100
Additional information
Heatwaves were defined as three consecutive days where both the maximum and the minimum temperature exceed their respective 95th percentile from the historical period. Based on 50 climate model projections from the Coupled Model Intercomparison Project Phase 5 (CMIP5) (Taylor et al., 2012), under the RCP8.5 climate scenario. The 50th percentile (median) scenario is available in the Urban Adaptation Map Viewer, see also Guerreiro et al. (2018).
Source: Adapted from Guerreiro et al. (2018)