1. Reporting requirements for greenhouse gas emissions
The assessments of progress towards greenhouse gas (GHG) emission targets presented in this report are, for the most part, based on information submitted by Member States themselves under Regulation (EU) No 525/2013, the Monitoring Mechanism Regulation (MMR) (EU, 2013a).
The initial purposes of the reporting requirements stipulated in the MMR are to enable the European Union (EU) to complete its reporting commitments under the United Nations Framework Convention on Climate Change (UNFCCC), and to evaluate the projected progress of the EU and its Member States towards fulfilling their GHG mitigation commitments under the Kyoto Protocol in annual reports prepared by the European Commission and the European Environment Agency (EEA).
Implementing provisions (EU, 2014a) provide a structure and format for the reporting of GHG inventories and approximated GHG inventories, information on policies and measures, GHG projections and the use of auctioning revenue and project credits, and are used for the purposes of the LULUCF (land use, land-use change and forestry) Decision (EU, 2013b). Furthermore, a delegated act (EU, 2014b) defines the substantive requirements for an EU inventory system in order to fulfil the obligations pursuant to Decision 19/CMP.1.
2. Data sources for greenhouse gas emissions
The analysis presented in this report is based on several sets of GHG emission data.
Historic trends of greenhouse gas emissions
GHG emission data for the period from 1990 to 2014 are official data reported by the EU and Member States under the UNFCCC in their corresponding GHG inventory reports (EEA, 2016a and 2016b). The EEA is responsible for the compilation of the EU GHG inventory and, together with the European Topic Centre on Air Pollution and Climate Change Mitigation (ETC/ACM) [1], it implements a quality assurance and quality control (QA/QC) procedure (EC, 2013a) in order to ensure the timeliness, completeness, consistency, comparability, accuracy and transparency of the projections reported by Member States and used in this report. In 2016, a comprehensive review of GHG emission data took place under article 19 of the MMR, in the context of the annual compliance cycle under the Effort Sharing Decision (ESD). This concerned the years 2005, 2008–2010, 2013 and 2014.
Approximated greenhouse gas emissions for 2015
Early ‘approximated’ (proxy) estimates of 2015 GHG emissions were reported by Member States to the European Commission under the MMR by 31 July 2016. These estimates were aggregated to EU level by the EEA (EEA, 2016c). Bulgaria, Cyprus, Lithuania and Romania did not submit proxy GHG inventories. The missing data were gap filled by EEA and ETC/ACM for the calculation of EU totals. For Luxembourg and Malta, which submitted after the deadline, gap filled estimates were taken into account for the calculation of EU totals, but the assessment of these countries progress towards ESD targets in 2015 was based on the reported data.
Greenhouse gas emissions in the European Union Emissions Trading System since 2005
Data relative to the EU Emissions Trading System (ETS) are used to analyse emission trends in the EU ETS, but also to determine the level of emissions covered under the ESD. For the years 2005–2012, ETS emissions include estimates to reflect the scope of the EU ETS for the third trading period. These data are publicly available from the European Union Transaction Log (EUTL) [2] and the EEA ETS data viewer (EEA, 2016d). The data considered in the analysis were extracted from the EUTL on 13 September 2016.
Emissions covered under the Effort Sharing Decision
For the purpose of analysing emission trends in the ESD, historic 2005 ESD emissions are calculated using the latest GHG inventory data, from which ETS emissions and CO2 emissions from domestic aviation are subtracted. ETS emissions include estimates to reflect the scope of the EU ETS for the third trading period for the years 2005–2012.
The ESD GHG emission data for the years 2013 and 2014 are consistent with the outcome of the 2016 comprehensive review of national GHG inventory data pursuant to Article 19(1) of the MMR, which was concluded on 30 August 2016. The data used by the Commission to determine Member States’s compliance under the ESD for 2013 and 2014 will be made publicly available (EC, 2016 and 2017).
Long-term historic trends of Emissions Trading System and Effort Sharing Decision emissions
For Figure 1.2, Figure 1.3 and Figure 1.4, GHG emissions for the years 1990–2015 are split into those covered by the EU ETS and those covered by the ESD. These splits are based on the application of a fixed percentage for each of the main source categories defined by the Intergovernmental Panel on Climate Change (IPCC) for the reporting of national GHG inventories:
- energy sector (IPCC sectors 1.A.1, 1.B and 1.C): 90 % for ETS/10 % for ESD;
- the manufacturing and construction sector (IPCC sector 1.A.2): 71 % for ETS/29 % for ESD;
- the residential and commercial sectors (IPCC sectors 1.A.4 and 1.A.5): 1 % for ETS/99 % for ESD;
- the industrial processes sector (IPCC sector 2): 60 % for ETS/40 % for ESD;
- the transport (without aviation), agriculture and waste sectors (IPCC sectors 1.A.3, 3 and 5): 100 % for ESD;
- the aviation sector (IPCC sector 1A3a and memo item international bunkers): 34 % for ETS.
Projections for ETS and ESD are reported by source categories. The separation of ETS GHG emissions into source categories was partly carried out by applying average sectoral percentages to total ETS GHG emissions for Poland only.
The 2005 Effort Sharing Decision base-year emissions
The 2005 ‘ESD base-year emissions’ are calculated by EEA, so as to be consistent with both:
- the relative 2020 ESD target (as a percentage of 2005 emissions) defined in the ESD (EU, 2009);
- the absolute 2020 ESD target determined by the Commission (EC, 2013b and 2013c).
The EEA calculates 2005 ‘ESD base-year emissions’ as follows:
ESD base-year emissions = 2020 absolute target/(1 + % of 2020 ESD target)
These calculated ESD base-year emissions can also be used to, for example, compare relative changes in ESD emissions with 2020 ESD targets expressed in percentage.
In this report, calculated 2005 ESD base-year emissions are used to express the distance between ESD emissions and ESD targets in a normalised way (see, for example, Figure 2.1 and Figure 2.2). The distance, calculated as the absolute difference between emissions and targets divided by 2005 base-year emissions, is expressed in percentage points (a proportion of 2005 base-year emissions). It is then directly comparable with targets and reductions as percentages of 2005 levels and allows relevant comparisons from one Member State to another (see section A3.3).
These calculated 2005 ESD base-year emissions may differ, sometimes significantly, from actual historic 2005 emissions under the ESD based on the latest GHG inventories, ETS verified emissions and EEA estimate of emissions for 2005–2012 to reflect the current scope of the EU ETS (see above).
Projections of greenhouse gas emissions
The report uses GHG projection data that are reported biennially by Member States under the MMR (EEA, 2016e). Mandatory reporting takes place every 2 years (2013, 2015, etc.). Member States must also report substantial changes to projections every other year (2014, 2016, etc.). Member States have submitted projections as follows:
- In 2015, all Member States except Greece submitted projections.
- In 2016, eight Member States (Austria, Cyprus, Denmark, France, Ireland, Greece, Hungary and Luxembourg) as well as Norway and Switzerland provided updated projections. All updated projections have been included until 7 July 2016.
Under the MMR, Member States report projections in two scenarios:
- A ‘with existing measures’ (WEM) scenario, which considers the implementation of existing (already implemented) measures, can be applied.
- If available, a ‘with additional measures’ (WAM) scenario, which also considers the implementation of additional measures (at planning stage), can be applied. In 2015, 18 Member States reported projections on the basis of such WAM scenarios: Austria, Croatia, Cyprus, the Czech Republic, Estonia, Finland, Hungary, Ireland, Italy, Latvia, Lithuania, Malta, the Netherlands, Portugal, Romania, Slovakia, Spain and the United Kingdom. For the aggregation of a WAM scenario at EU level, Member States that have not reported a WAM scenario have been gap-filled using the WEM scenario.
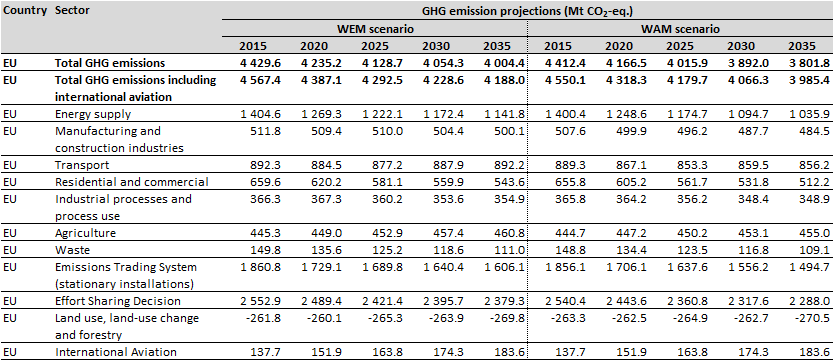
An overview of projected emissions for both scenarios is presented in Table 2 of the annex “Background information - International climate commitments in Europe”
Member States reported projections for total and sectoral GHG emissions, as well as a split of these projections between those covered by the EU ETS and those covered by the ESD, by source categories [3]. Although projections of total emissions are relevant to the assessment of the EU’s progress towards its 20 % reduction target by 2020, the assessment of the projected progress of Member States towards their national 2020 targets, set under the ESD as part of the climate and energy package, is based on projection data on emissions not covered by the EU ETS, i.e. ‘ESD projections’.
The EEA implements a quality assurance and quality control (QA/QC) procedure in order to ensure the timeliness, completeness, consistency, comparability, accuracy and transparency of the projections reported by Member States and used in this report. This procedure is described inElements of the Union system for policies and measures and projections and the quality assurance and control (QA/QC) programme as required under Regulation (EU) No 525/2013(EC, 2015). If significant discrepancies can be observed between the inventory value for the reference year and the projected year, an alignment of the level of projections is performed. Such calibration is performed in order to match national projections with a common reference year for aggregated EU projections, which is the year 2013. When such calibration took place in 2015, national GHG inventory data as of 30 June 2015 were used. For updated projections, calibrations were performed in 2016 against national GHG inventory data from 15 January 2016. Calibrations took place for Bulgaria, Croatia, the Czech Republic, Malta, the Netherlands and Portugal.
Click on the image for interactive data visualisation
Note: (a) Reported projections calibrated by EEA, in order to bring consistency with historic emissions.
(b) Reported projections not quality checked by EEA.
Projections for emissions under the Emissions Trading System concern stationary installations only (aviation not included).
Total GHG emissions do not include emissions from international aviation or net emissions or removals from Land use, land-use change and forestry (LULUCF).
NE: Not estimated.
Source: EEA, 2016e.
Annual emission targets (annual emission allocations) under the Effort Sharing Decision for the period from 2013 to 2020
The annual emission allocation (AEA) values for the period from 2013 to 2020 were defined in Commission Decision No 2013/162/EU (EC, 2013b) and adjusted according to Commission Implementing Decision No 2013/634/EU (EC, 2013c), in order to reflect the change in scope of the EU ETS in 2013.
3. Tracking progress towards targets under the Effort Sharing Decision
The progress of Member States towards their targets under the ESD is assessed by comparing ESD GHG emission levels with the relevant annual targets under the ESD. The assessment does not take into account the possible use of flexibility options as permitted under the ESD and is therefore not an assessment of compliance under the ESD.
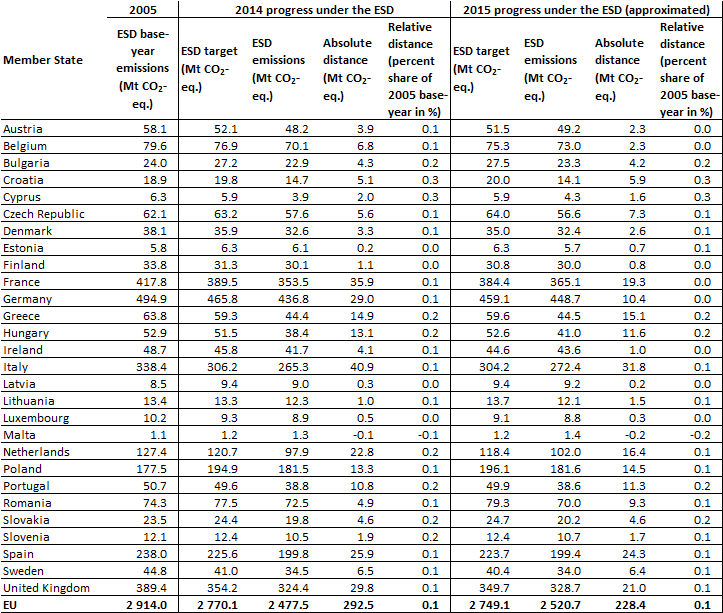
The assessment of current progress towards 2014 ESD targets is based on a comparison between ESD GHG emissions and ESD targets (AEAs) for 2014:
- Member States with historic emissions below their annual ESD target are considered to be currently on track towards their targets under the ESD.
- By contrast, Member States with historic emissions higher than their ESD target are considered not to be currently on track towards their targets under the ESD.
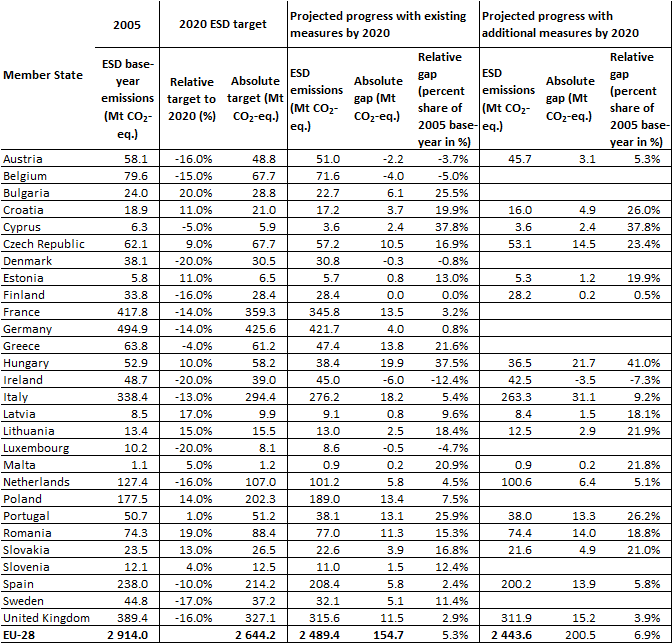
The assessment of projected progress towards 2020 ESD targets is based on a comparison between projected domestic ESD GHG emissions in the WEM scenario in 2020 and ESD targets (AEAs) for 2020:
- Member States with WEM projections lower than their 2020 target are projected to be on track towards their targets.
- Member States with WEM projections higher than their 2020 target are not projected to be on track towards their targets.
All the data used for this assessment (ESD GHG emissions and absolute annual ESD targets (AEAs)) are consistent with the scope of the EU ETS for the period from 2013 to 2020.
Click on the image for interactive data visualisation
Note: Gaps (i.e. surpluses of emission allocations compared with existing emissions) are calculated as ‘ESD target’ – ‘ESD GHG emissions’. A positive value indicates a surplus of AEAs (emissions lower than the target), while a negative value indicates a shortfall of AEAs (emissions lower than the target).
Approximated 2015 ESD emissions were estimated by the EEA on the basis of data submitted by Member States.
See section A3.2 with regard to the calculation of ‘2005 base-year emissions’ by the EEA.
Source: EC, 2013b, 2013c and 2017; EEA, 2016a, 2016b, 2016c and 2016d; EU, 2009.
Click on the image for interactive data visualisation
Note: Gaps are calculated as ‘ESD target’ – ‘ESD GHG emissions’. A positive value indicates a surplus of AEAs (emissions lower than the target), while a negative value indicates a shortfall of AEAs (emissions lower than the target).
See section A3.2 with regard to the calculation of ‘2005 base-year emissions’ by the EEA.
Source: EC, 2013b and 2013c; EEA, 2016e; EU, 2009.
4. Use of flexibilities under the Effort Sharing Decision
The assessment of progress towards the 2020 ESD targets does not directly take into account the possible use of flexibility options as permitted under the ESD, since these are specifically destined for compliance [4]. If these are taken into account, it is apparent that Malta will need to buy additional AEAs from other Member States or use international certificates to comply in the years 2013 to 2015. This is the case because the gaps between emissions and AEA amounts for these years are higher than the 5 % that is allowed to be borrowed from the following year (i.e. 0.06 million AEAs for Malta).
Taking into account WEM emissions, for all other countries apart from Ireland, the use of the flexibility to carry over AEAs that have not been used in previous years will be sufficient for compliance in the 2013 to 2020 period. Additional measures, as considered in WAM projections, would help Ireland to comply without the need to buy further AEAs.
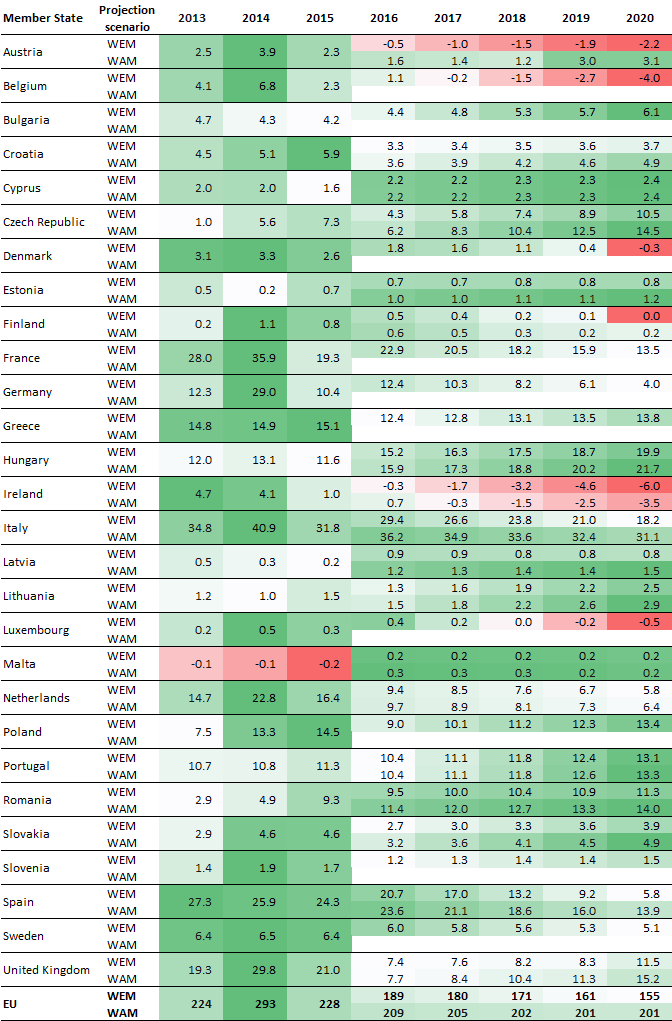
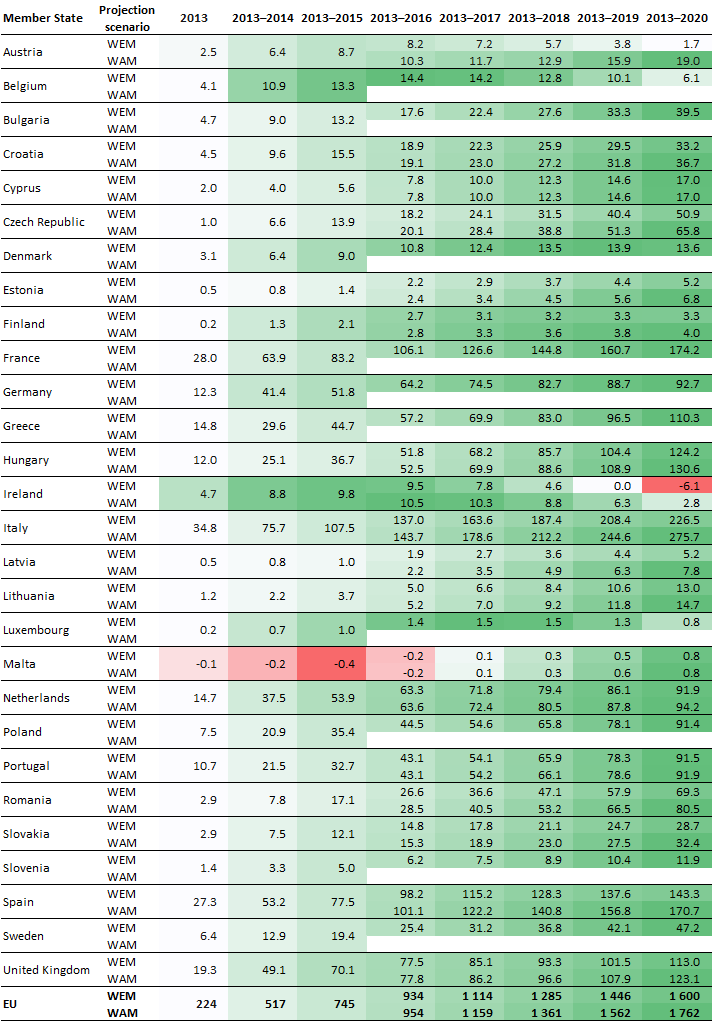
5. Annual and cumulated gaps between emissions and Effort Sharing Decision targets
Click on the image for interactive data visualisation
Note: A positive value (green shading) indicates a surplus of AEAs (emissions lower than the target), while a negative value (red shading) indicates a shortfall of AEAs (emissions lower than the target). The darker the colour, the larger the gap (red) or the surplus (green).
The calculations do not take into account any possible use of the flexibilities provided under the ESD (such as trading ESD emission allocations or buying international certificates).
The data are based on ESD emissions for 2013 and 2014 as determined after the 2016 comprehensive review of national GHG inventories, approximated inventory data for 2015 and projections for the 2016–2020 period. No national approximated GHG data were available for four Member States (Bulgaria, Cyprus, Lithuania and Romania). For these, the EEA GHG emission proxy was used instead. Inconsistencies in the time series between 2015 and 2016 might be observed for some countries. This is likely because projections for the period 2013–2020 were prepared before actual 2014 and 2015 emissions were available. For the aggregation of projections in the WAM scenario at EU level, WAM projections of Member States which did not report a WAM scenario have been gap-filled using the WEM scenario projections.
Source: EC, 2013b, 2013c, 2016 and 2017; EEA, 2016a, 2016b, 2016c, 2016d and 2016e.
Click on the image for interactive data visualisation
Note: A positive value (green shading) indicates a surplus of AEAs (emissions lower than the target), while a negative value (red shading) indicates a shortfall of AEAs (emissions lower than the target). The darker the colour, the larger the gap (red) or the surplus (green).
The calculation of the cumulated gap takes only previous years’ gaps into account, but does not take any possible use of the flexibilities provided under the ESD (such as trading ESD emission allocations or buying international certificates) into account.
The data are based on ESD emissions for 2013 and 2014 as determined after the 2016 comprehensive review of national GHG inventories, approximated inventory data for 2015 and projections for the 2016–2020 period. No national approximated GHG data were available for four Member States (Bulgaria, Cyprus, Lithuania and Romania). For these, the EEA GHG emission proxy was used instead. Inconsistencies in the time series between 2015 and 2016 might be observed for some countries. This is likely because projections for the period 2013–2020 were prepared before actual 2014 and 2015 emissions were available. For the aggregation of projections in the WAM scenario at EU level, WAM projections of Member States which did not report a WAM scenario have been gap-filled using the WEM scenario projections.
Source: EC, 2013b, 2013c, 2016 and 2017; EEA, 2016a, 2016b, 2016c, 2016d and 2016e.

Document Actions
Share with others