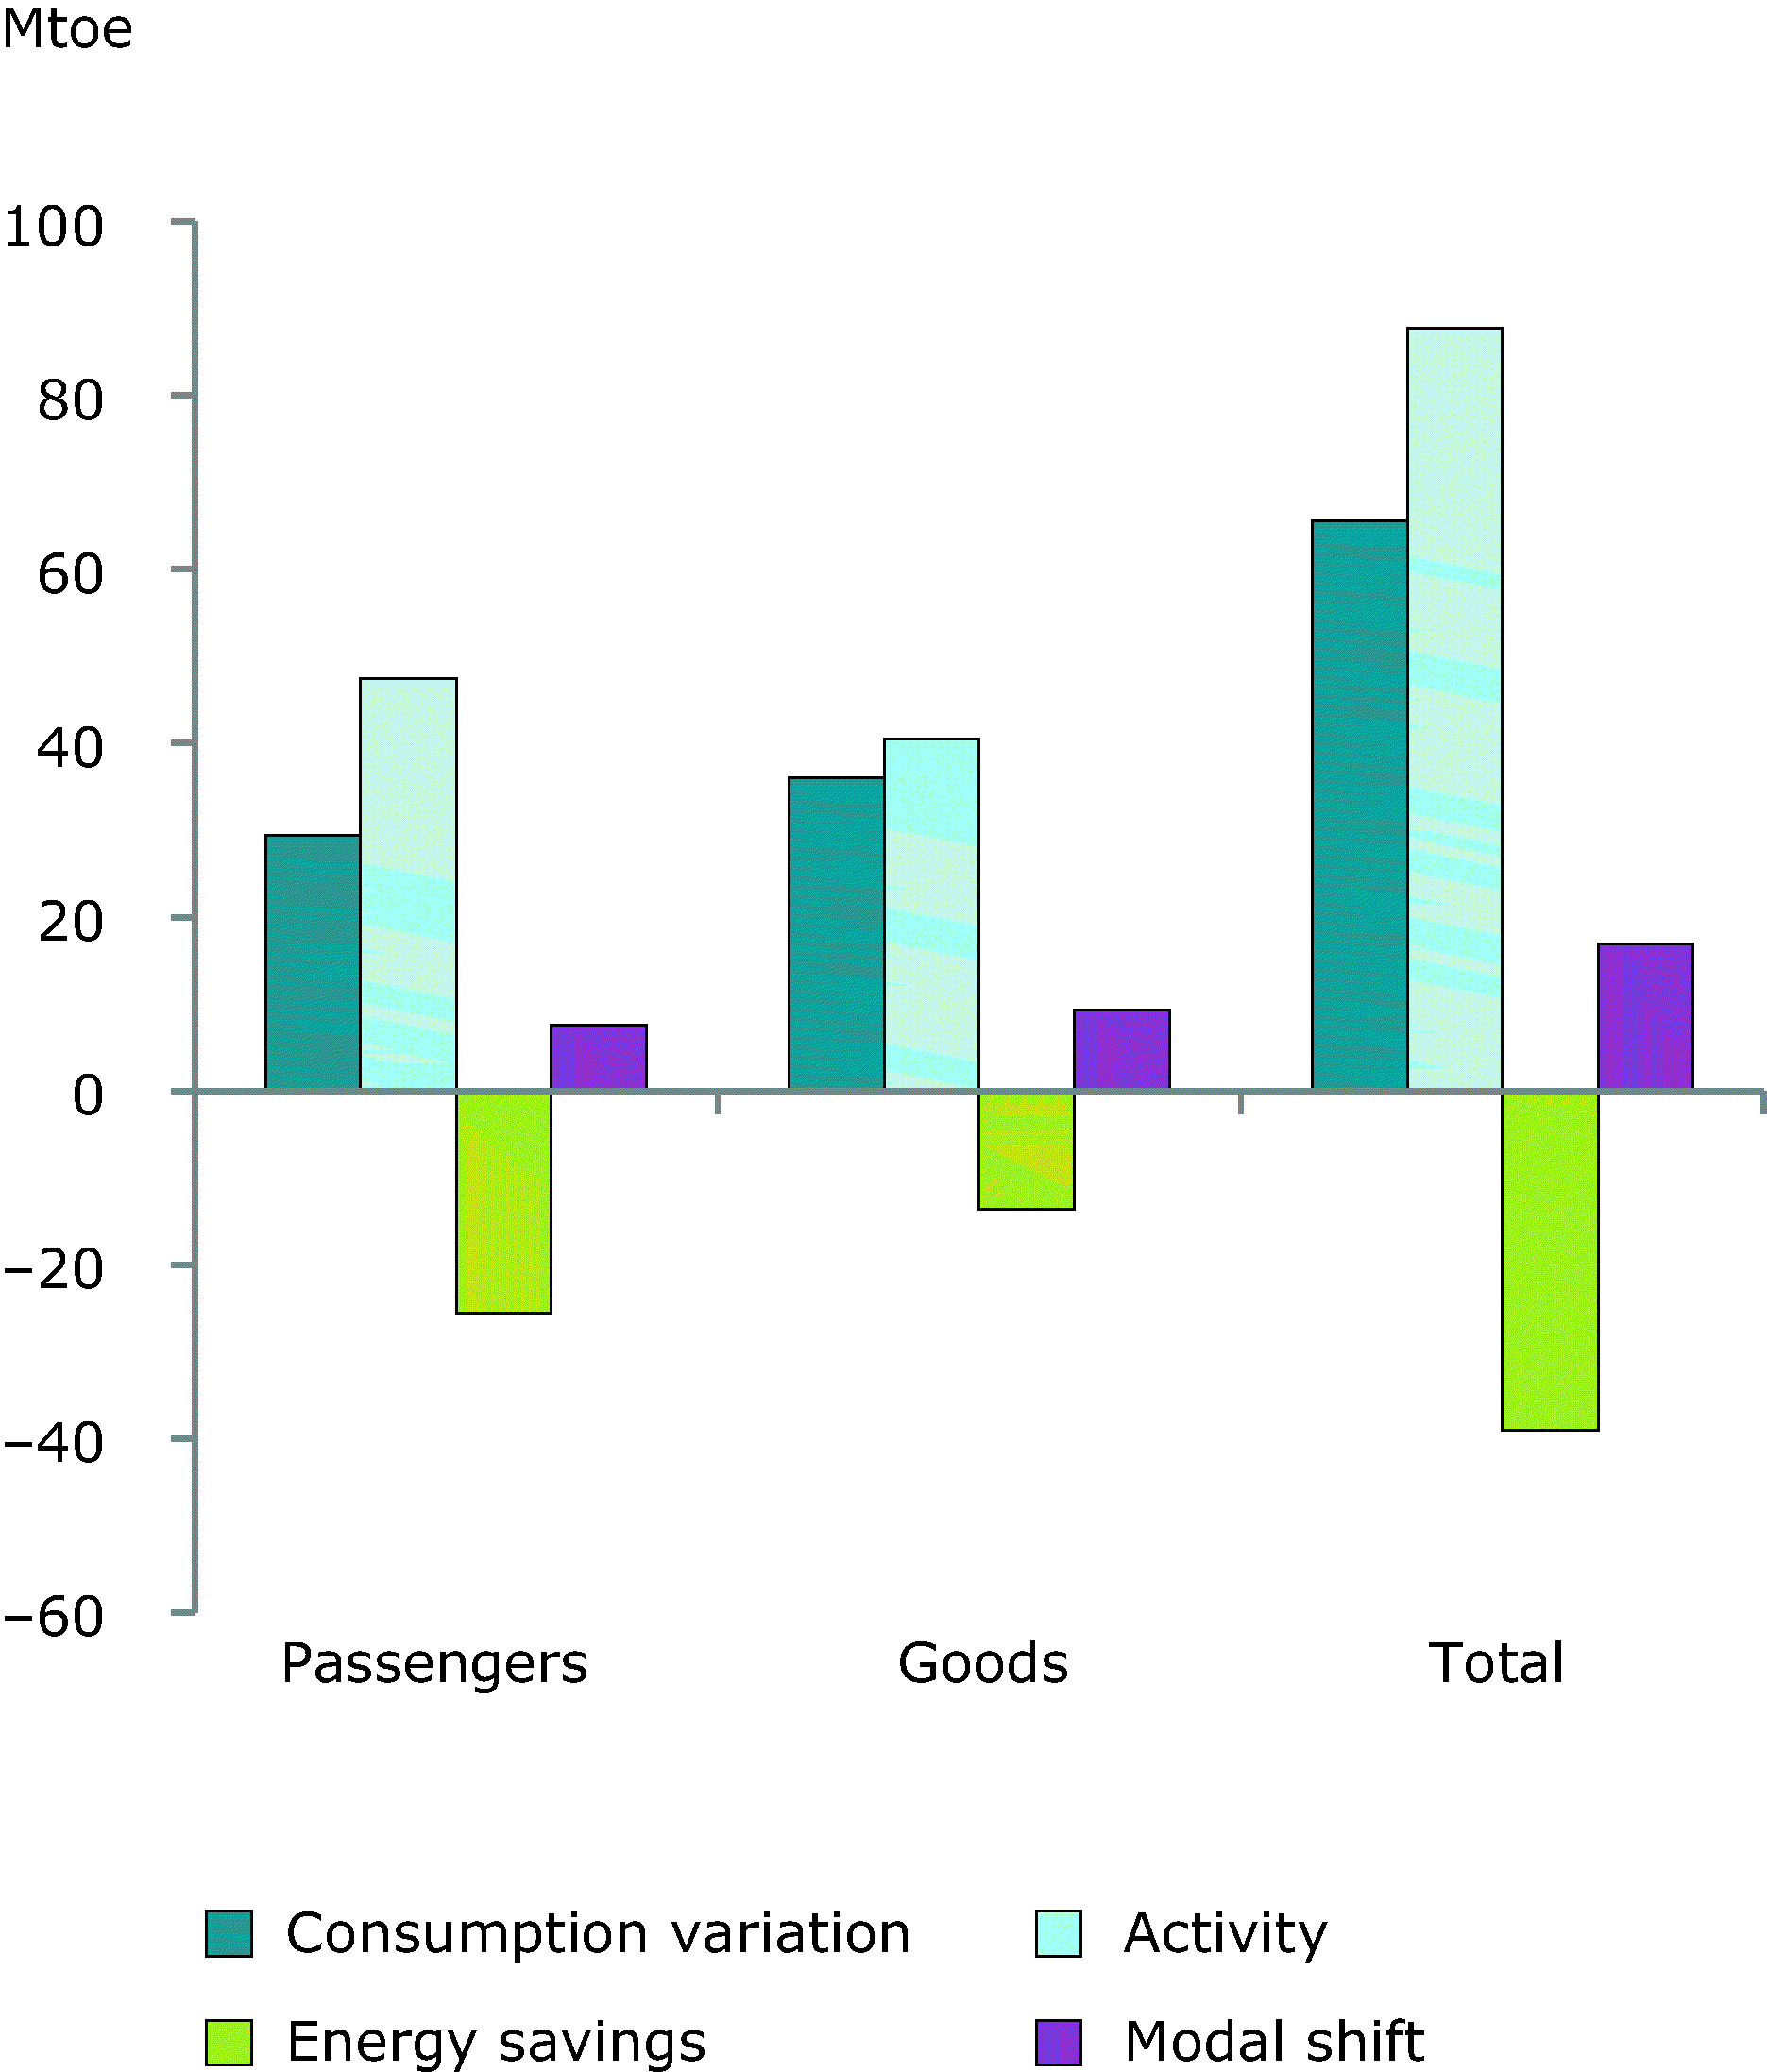
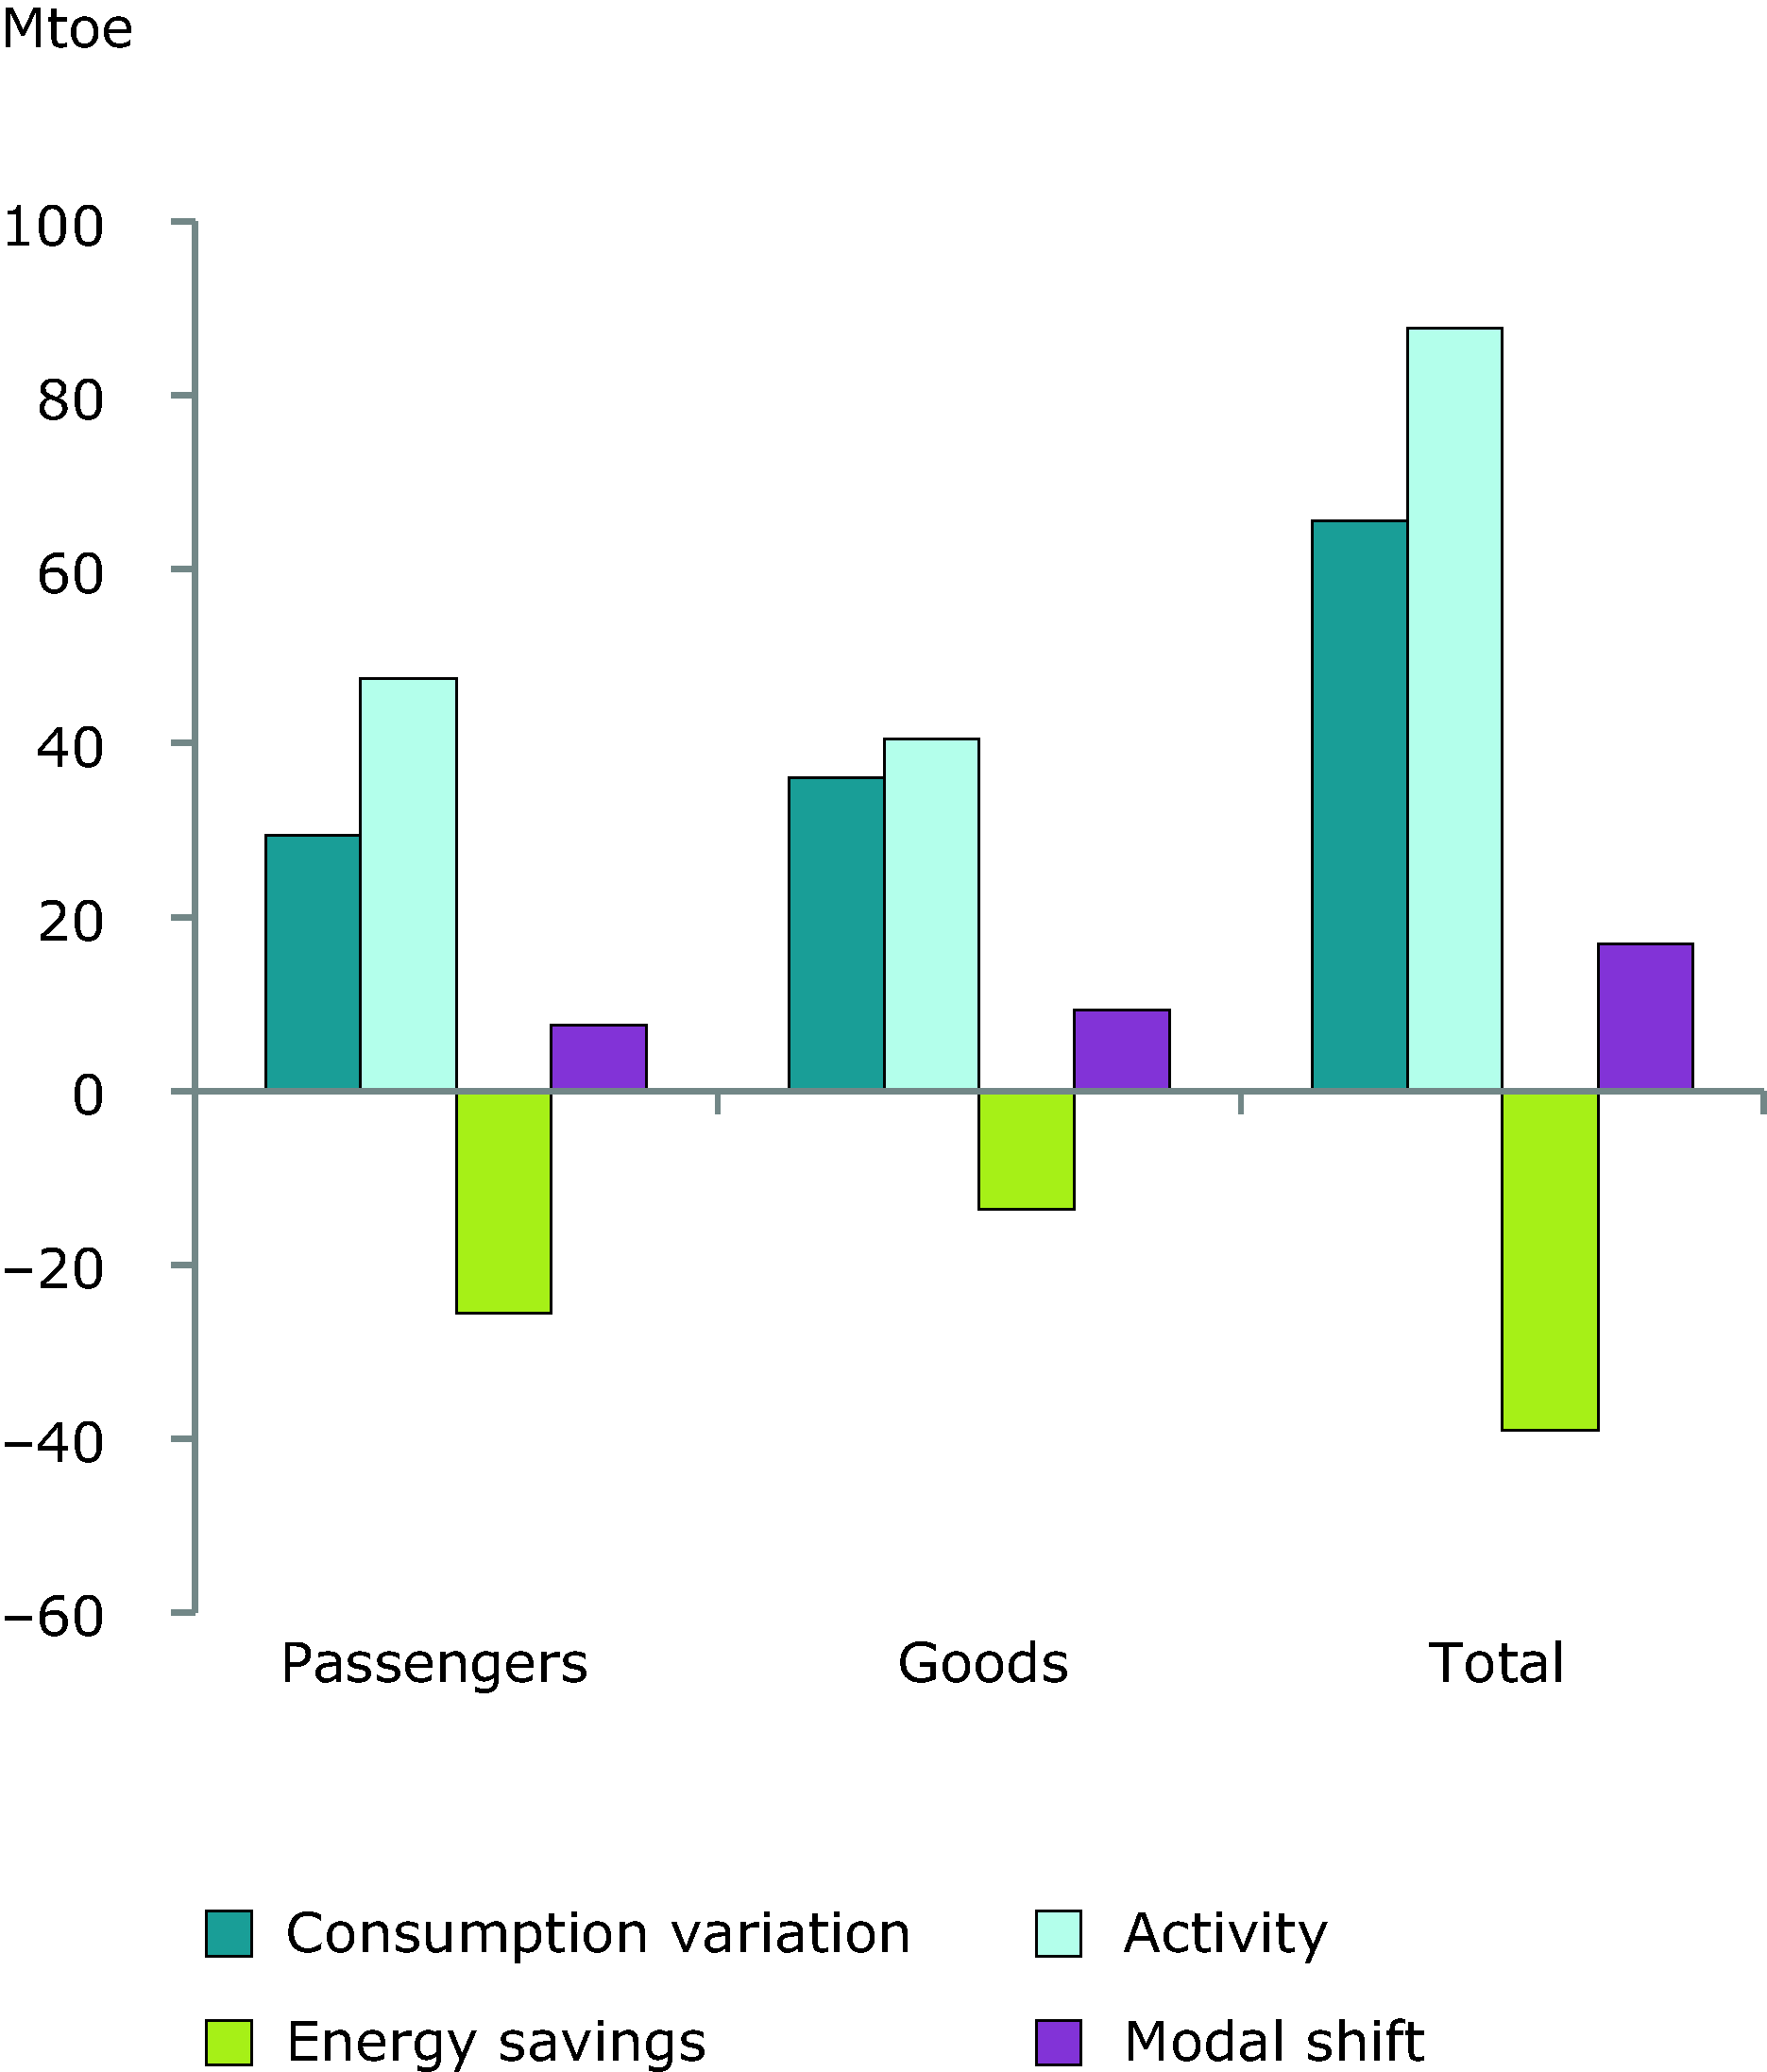
The energy consumption variation of passenger and goods transport is broken down into 2 explanatory effects:
- activity effect (increase in traffic)
- global energy savings (change in specific energy consumption per unit of traffic)
The calculations refer to the definition used in the ESD Directive and excludes air transport
Activity effect = ∆ T i, (t,t-1) * SCT i, t-1
- T : Traffic (in passenger-kilometer or ton-kilometer),
- SCT: Specific consumption per unit of traffic (goe/tkm or goe/pkm),
- i= passenger or goods
Global savings effect = T i, t * ∆SCT i,(t,t-1)
- (savings are <o), Global savings are actually the sum of savings by each mode individually and savings due to modal shift
Global savings effect = ∑ savings by mode i, j + savings from modal shift i
- i= passenger or goods
- j= transport mode (car or bus or rail for passenger; road, rail or water for goods)
Sum of savings by mode for passengers are the sum of the savings
calculated for cars, bus and rail ; savings for goods are the sum of
savings calculated for road, water and rail separately
Savings by mode j , SAVj, are calculating as follows SAV j = ∆ SCT j * T j, t
Savings from modal shift for passengers are <0 abd represent real
savings if there is an increase in the share of public transport in
total traffic for passenger
Savings from modal shift for goods are <0 if there is an increase in the share of rail and water in total traffic for goods
See indicator ENER023


Document Actions
Share with others