All official European Union website addresses are in the europa.eu domain.
See all EU institutions and bodies
An official website of the European Union | How do you know?
Environmental information systems
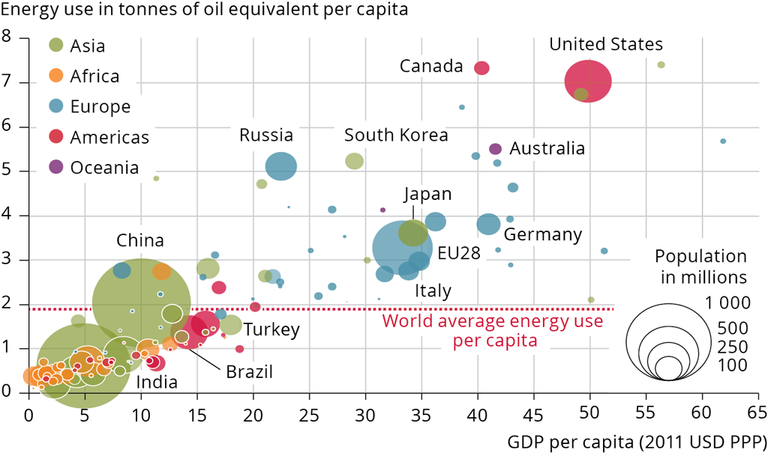
The graph shows per capita energy consumption (kg oil equivalent) vs. per capita GDP, PPP (current international $). The size of the bubbles denotes total poulation per country. All values refer to the year 2011.
Loading