All official European Union website addresses are in the europa.eu domain.
See all EU institutions and bodiesAn official website of the European Union | How do you know?
Environmental information systems
EN
This briefing provides a snapshot of the status of trading non-hazardous, recyclable waste within the EU, to provide knowledge and information to support the review of the EU’s Waste Shipment Regulation. The information and knowledge in the briefing aims to improve the functioning of secondary material markets by offering insights and potential solutions to help ensure that waste is treated in the best possible way in line with the principles of the waste hierarchy.
Key messages
More than 90% of waste generated in the EU is treated in the country in which it was generated, respecting the proximity principle underpinning EU waste law.
However, the non-hazardous, recyclable waste scoped in this briefing should be considered an exception. Making use of the EU’s single market for shipping non-hazardous recyclable waste offers opportunities to find the best available treatment options, allowing good-quality secondary raw materials to be produced and respecting the principles of a circular economy.
One benefit of waste shipments is that they allow the development of economies of scale for recycling. This, in turn, offers the opportunity for the advancement of recycling technologies, security of supply and lower prices for secondary raw materials. Ultimately, this would improve the functioning of secondary raw material markets within the EU’s single market.
Recyclable waste that is shipped to other EU countries accounts for a significant share of the quantities generated, representing a total value of EUR 12 billion, dominated by ferrous metals that make up 69% of the total. Data reveal a growing and dynamic market for internationally traded waste materials.
The EU is currently revising its Waste Shipment Regulation (from 2006), which governs shipments both within the EU and from and to the EU. One of the aims of this revision is to align the regulation with circular economy principles. The revision is based on a study, known as an impact assessment, by the European Commission, analysing the socio-economic and environmental impacts of potential changes to the regulation. The EEA’s work on the EU’s internal waste shipments summarised in this briefing is viewed as complementary to this impact assessment.
The role of waste shipments in a circular economy
An essential condition for establishing a circular economy is retaining as high a value as possible for materials that become waste. This will reduce the demand for extracting natural resources, which is associated with significant environmental and climate impacts globally. Meeting the economy’s needs through the good-quality recycling of waste materials has the potential to reduce these impacts substantially. This applies especially to materials that are very energy intensive to produce (e.g. metals), are based on fossil resources (e.g. plastics) or require the use of large amounts of land and water to produce (e.g. textiles). Shipments of non-hazardous waste for recycling purposes could be key to achieving this, especially for improving the secondary raw material markets, which in turn play a key role in meeting the EU’s raw material demands through secondary material sources.
More specifically, facilitated but still well-controlled shipments of waste within the EU may lead to the building of economies of scale, reducing the cost of waste treatment and therefore the price of secondary raw materials. Countries or individual stakeholders in the waste sector, if they secure adequate investments, could benefit from economies of scale through access to good-quality, separately collected waste, not only from their own country but also from other EU Member States. This would create opportunities for the development of good-quality, technologically advanced recycling facilities and economically competitive business models.
Moreover, the right incentives for increasing cross-border shipments of waste for recycling would increase the security of supply for recyclers. This would help recyclers to plan more effectively and, consequently, increase producers’ confidence in steady streams of secondary material resources, which has traditionally been a barrier to the further uptake of secondary materials in new production processes.
Such developments could result in lower prices for secondary raw materials produced from waste, with a favourable impact on their cost competitiveness compared with primary raw materials. This in turn could lead to the higher uptake of secondary raw materials in production processes.
Overall, the promotion of the right type of ‘intra-EU waste shipments’ of good-quality recyclable waste could optimise the effectiveness of material recovery and increase material circularity, one of the primary objectives of the circular economy policy agenda.
Volume and value of intra-EU waste shipments
More than 90% of the waste generated in the EU is treated in the country in which it was generated. This is in line with the proximity principle underpinning EU waste law, which calls for waste to be treated as close as possible to the point of generation to avoid the environmental impacts of transporting waste and to avoid exporting the impacts of waste management operations. The high share of waste treated in the same country it is generated is the result of decision-making by waste operators taking into account multiple factors, such as regulatory restrictions, economic considerations and environmental issues related to waste transport and treatment (see Figure 1). For example, restrictions and administrative burdens are in place in relation to waste being shipped by individual EU Member States. However, it is important to clarify that it is not the administrative burden associated with waste regulations that ultimatelyblocks the shipment of waste. Instead, it increases waiting times and the costs of shipments, which ultimately decreases profit margins and/or slows down resource movement. Most waste generated has a low intrinsic value compared with long-distance transport costs, meaning that operators would not make a profit if they were to ship waste to other countries.
Figure 1: Decision-making process in relation to shipping waste to other countries for treatment
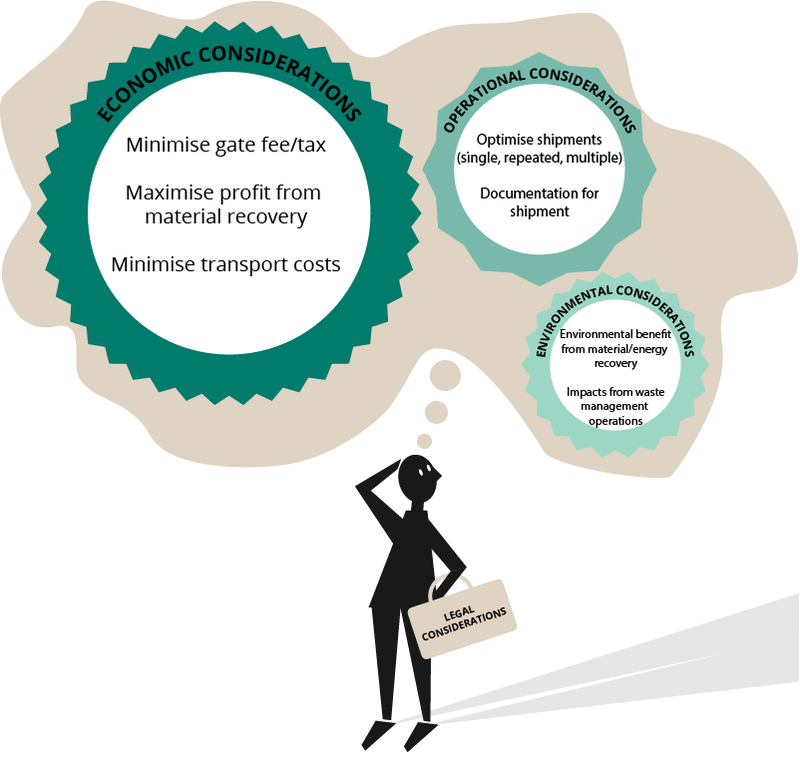
EEA
However, the volume and value of waste shipped across borders within the EU are significant. Over the past 15 years, the share of waste being traded across borders, rather than being treated in the country in which it was generated, has grown, albeit slowly. In 2018, around 6% of the total waste generated was shipped across borders, but within the EU. Table 1 shows the amounts of waste generated, by year, excluding major, in all EU Member States that are treated abroad, either outside the EU or in another EU Member State. The trends indicate that the secondary material markets for recyclable waste are growing in the EU. If these markets perform optimally, they could be the ideal vehicle for increasing both the quantity and quality of recycling in the EU.
Table 1: Total amounts of EU waste generated and total amounts of both hazardous and non-hazardous waste shipped inside and exported from the EU, in million tonnes
2004 | 2006 | 2008 | 2010 | 2012 | 2014 | 2016 | 2018 | |
|---|---|---|---|---|---|---|---|---|
Total EU waste generated (excl. major mineral wastes) | 781 | 790 | 760 | 759 | 758 | 770 | 785 | 809 |
Total waste exported from the EU | 18.6 | 19.5 | 24 | 30 | 32 | 28 | 29 | 31 |
Total waste shipped inside the EU | 42 | 44.5 | 46.4 | 46.4 | 46.4 | 46.4 | 45.3 | 49.2 |
The value of the commodities traded on secondary material markets is not insignificant: the value of non-hazardous recyclable waste traded across borders within the EU reached EUR 12.2 billion in 2019, with metals accounting for 69% of the total (Table 2). This is approximately equal to the annual gross domestic product (GDP) of Malta, indicating significant opportunities in these markets, especially if they are supported by measures to increase the price competitiveness of secondary materials.
Table 2: Total value of recyclable waste shipped within the EU in 2019
Paper and cardboard | Textiles | Plastics | Glass | Non-ferrous metals | Ferrous metals | Total | |
|---|---|---|---|---|---|---|---|
Value (million EUR) | 1,260 | 682 | 557 | 113 | 1,227 | 8,379 | 12,217 |
Ranking EU Member States based on the volume of recyclable waste dispatched and received
Data reported under the EU Waste Shipment Regulation and through Eurostat’s Comext database allow us to understand which waste flows are most prevalent. They also reveal which countries rank highest as destination countries for recyclable waste and in terms of dispatching waste, and if and how the prices of recyclable waste vary depending on the receiving EU Member State. For more details on the Comext database, please consult the technical report underpinning this briefing. An analysis of waste shipments within the EU at national level reveals that some Member States rely more than others on shipping their recyclable waste to other Member States for treatment, while some manage most of their waste within national borders.
If a country does not ship much waste to other countries, this might indicate that the country has designed its waste policy in line with the proximity principle, for instance by developing capacity to treat all the types of waste it generates. Another factor influencing how much waste is shipped across borders is country size: in general, smaller countries find it economically unfeasible to develop treatment facilities for all waste and all types of treatment, meaning that some waste has to be shipped elsewhere. In terms of receiving waste, steady and large imports of specific types of recyclable waste indicate that a country is cost competitive for treating those types of waste. This could be the result of the country’s investment in capacity (perhaps due to a particular industrial activity in the country needing the secondary material produced from the waste), the availability of technology and know-how in the country, or factors such as low labour costs.
On the other hand, the consistent export of low-value waste is typically associated with exporting polluting activities elsewhere. Through the revision of the Waste Shipment Regulation in 2021, the EU as a whole aims to restrict the exporting of waste to third countries to the minimum, to limit the exporting of environmental issues. Investigating individual countries’ reasons for exporting or importing waste is beyond the scope of this study.
Figure 2 shows the net shipments of six types of recyclable waste, as well as waste shipped for incineration, per Member State over time.
Figure 2: Net shipments of recyclable waste by EU Member State and waste type in 2016, 2017, 2018 and 2019, in tonnes
A closer look at the data shown in Figure 2 gives some insights into intra-EU shipments of specific types of waste:
Figure 3: Insights from recyclables trading among EU Member States
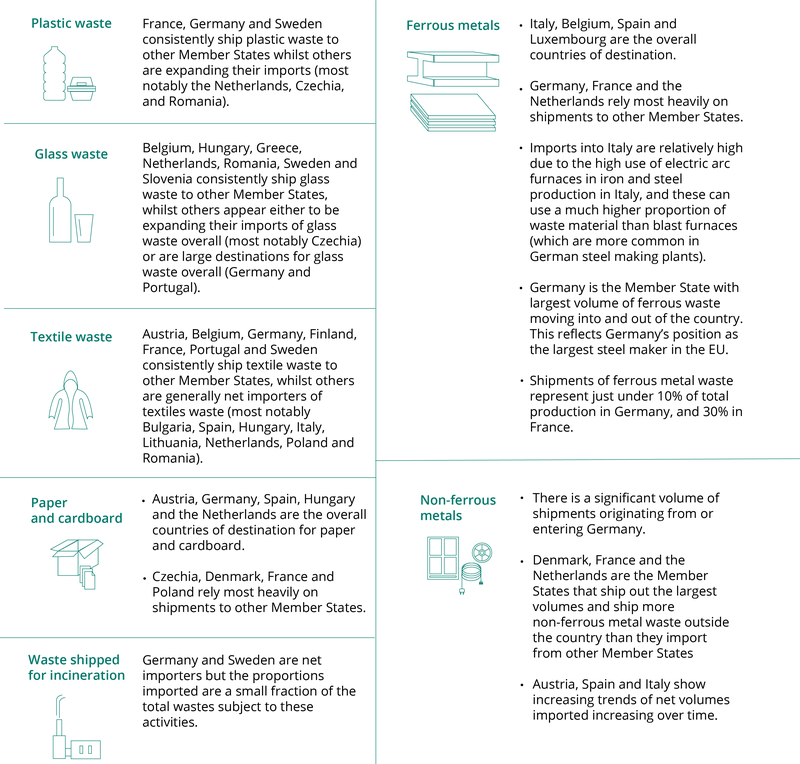
It should be underlined that this briefing covers shipments of waste only within the EU and does not reflect on quantities shipped to outside the Union. This means that countries with large ports might appear to import a relatively large volume of recyclables, while in fact most of these are then shipped out of the EU (e.g. the Netherlands for plastics).
Within the scope of this briefing, waste shipped for incineration is the only type of material investigated that is not destined for recycling. This includes mixed municipal waste, sorting residues and other materials not collected separately for recycling. This waste is destined to receive lower level treatment, according to the waste hierarchy, which is associated with greater environmental impacts. Aside from countries with no incineration capacity, EU Member States differ in how they manage their incineration capacities, with some relying on shipments to other Member States for the incineration of residual waste, because of a lack of capacity, and others relying on imports to fill incineration overcapacity (see Figure 3).
For example, as shown in Figure 3, Slovakia fills its incineration capacity through imports of residual waste, while, at the other end of the spectrum, Ireland and, to a lesser extent, Slovenia are heavily reliant on shipments to other countries for the incineration of their waste, which might indicate a lack of capacity for incinerating locally generated waste. It should be noted that Figure 3 relates exclusively to waste shipped from one EU Member State to another. However, EU Member States also export and import waste to and from countries outside the EU (e.g. imports of waste for incineration from the United Kingdom and exports to Norway and Switzerland).
Figure 4: Shipments of residual waste as a percentage of total non-hazardous waste incinerated in the EU, from 2010 to 2018
Ranking EU Member States based on the value of recyclable waste dispatched and received
Figure 4 shows the value per unit of recyclable waste shipped from each Member State in 2019. If it is assumed that the value of recyclable waste is an indication of its quality for recycling, it can be deduced that countries that ship high-value recyclable waste to other countries have good waste management systems in place (e.g. separate collection, advanced sorting, etc.) or possibly lack the infrastructure to complete all steps of the recycling value chain within their own borders.
Figure 5: Value of waste shipments by recyclable material shipped from a specific Member States to other Member States, in EUR/tonne
A closer look at the data shown in Figure 4 helps to explain why shipments from some countries fetch better prices than those from other countries. In other words, these data shed some light on what determines the price of a waste shipment. A good example comes from Cyprus, where more than two thirds of shipments of paper and cardboard waste have already been sorted, making the value of the shipped materials generally higher than that of the unsorted streams shipped by other Member States.
Plastic waste shipped from Portugal generally comprises polyethylene terephthalate (PET) and PET mixed with other plastics. The fact that PET generally has the highest value of all plastic waste is thought to explain the higher value per tonne of plastic waste shipments from Portugal than from other Member States. At the opposite end of the spectrum, Cyprus generally ships only mixed plastic waste, accounting for the relatively low value of shipped plastic waste from this country. This pattern is seen among other Member States: the higher the degree of sorting of plastic waste before shipment, the greater the value of the plastic waste shipped.
The composition of shipments also plays a key role in determining the value of other types of waste shipments. For example, almost 85% of non-ferrous metal shipments from Ireland comprise lead scrap, which has a relatively high average market value and is therefore likely to explain the higher value of non-ferrous scrap from Ireland than from other EU Member States. Within the ferrous metal category, Ireland is also a clear outlier. Ireland’s shipments to other EU Member States are dominated by shredded iron and steel (61% of total shipments) and ferrous metal alloys (25% of total shipments). However, it is the value of stainless steel scrap from Ireland that appears to account for the biggest difference in value between Ireland and other Member States.
In general, the functioning of a country’s waste management system is a critical determinant of the value of waste shipments. Extensive separate collection and optimal sorting of waste into different quality grades result in large quantities of relatively homogeneous waste material, which can be traded at higher prices. On the other hand, mixed waste, where high-quality materials are mixed with low-quality materials, is generally traded at lower prices.
The data presented here cannot, however, account for other aspects that determine the value of waste shipments, such as the technological specialisation of some countries for recycling specific waste materials, the investment in economies of scale for treatment facilities by some countries, or the role of labour and transportation costs. Further analysis, investigating economic conditions in each country, is necessary to account for these aspects.
Briefing no. 14/2021
Title: Linking cross-border shipments of waste in the EU with the circular economy
HTML - TH-AM-21-014-EN-Q - ISBN 978-92-9480-409-9 - ISSN 2467-3196 - doi: 10.2800/579515
PDF - TH-AM-21-014-EN-N - ISBN ISBN: 978-92-9480-410-5 - ISSN 2467-3196 - doi: 10.2800/013029
- Major mineral waste is generated in high volumes and is scarcely moved across borders because of its high weight and low value. Therefore, including this type of waste in Table 1 would skew the conclusions drawn from it.↵