All official European Union website addresses are in the europa.eu domain.
See all EU institutions and bodiesAn official website of the European Union | How do you know?
Environmental information systems
EN
- БългарскиBG
- češtinaCS
- HrvatskiHR
- danskDA
- NederlandsNL
- ελληνικάEL
- EnglishEN
- eestiET
- SuomiFI
- FrançaisFR
- DeutschDE
- magyarHU
- ÍslenskaIS
- italianoIT
- LatviešuLV
- lietuviųLT
- MaltiMT
- NorskNO
- polskiPL
- PortuguêsPT
- RomânăRO
- slovenčinaSK
- SlovenščinaSL
- EspañolES
- SvenskaSV
- TürkçeTR
Table 1 Key sectors driving the EEA-32 region ecological footprint
Infographic (static)
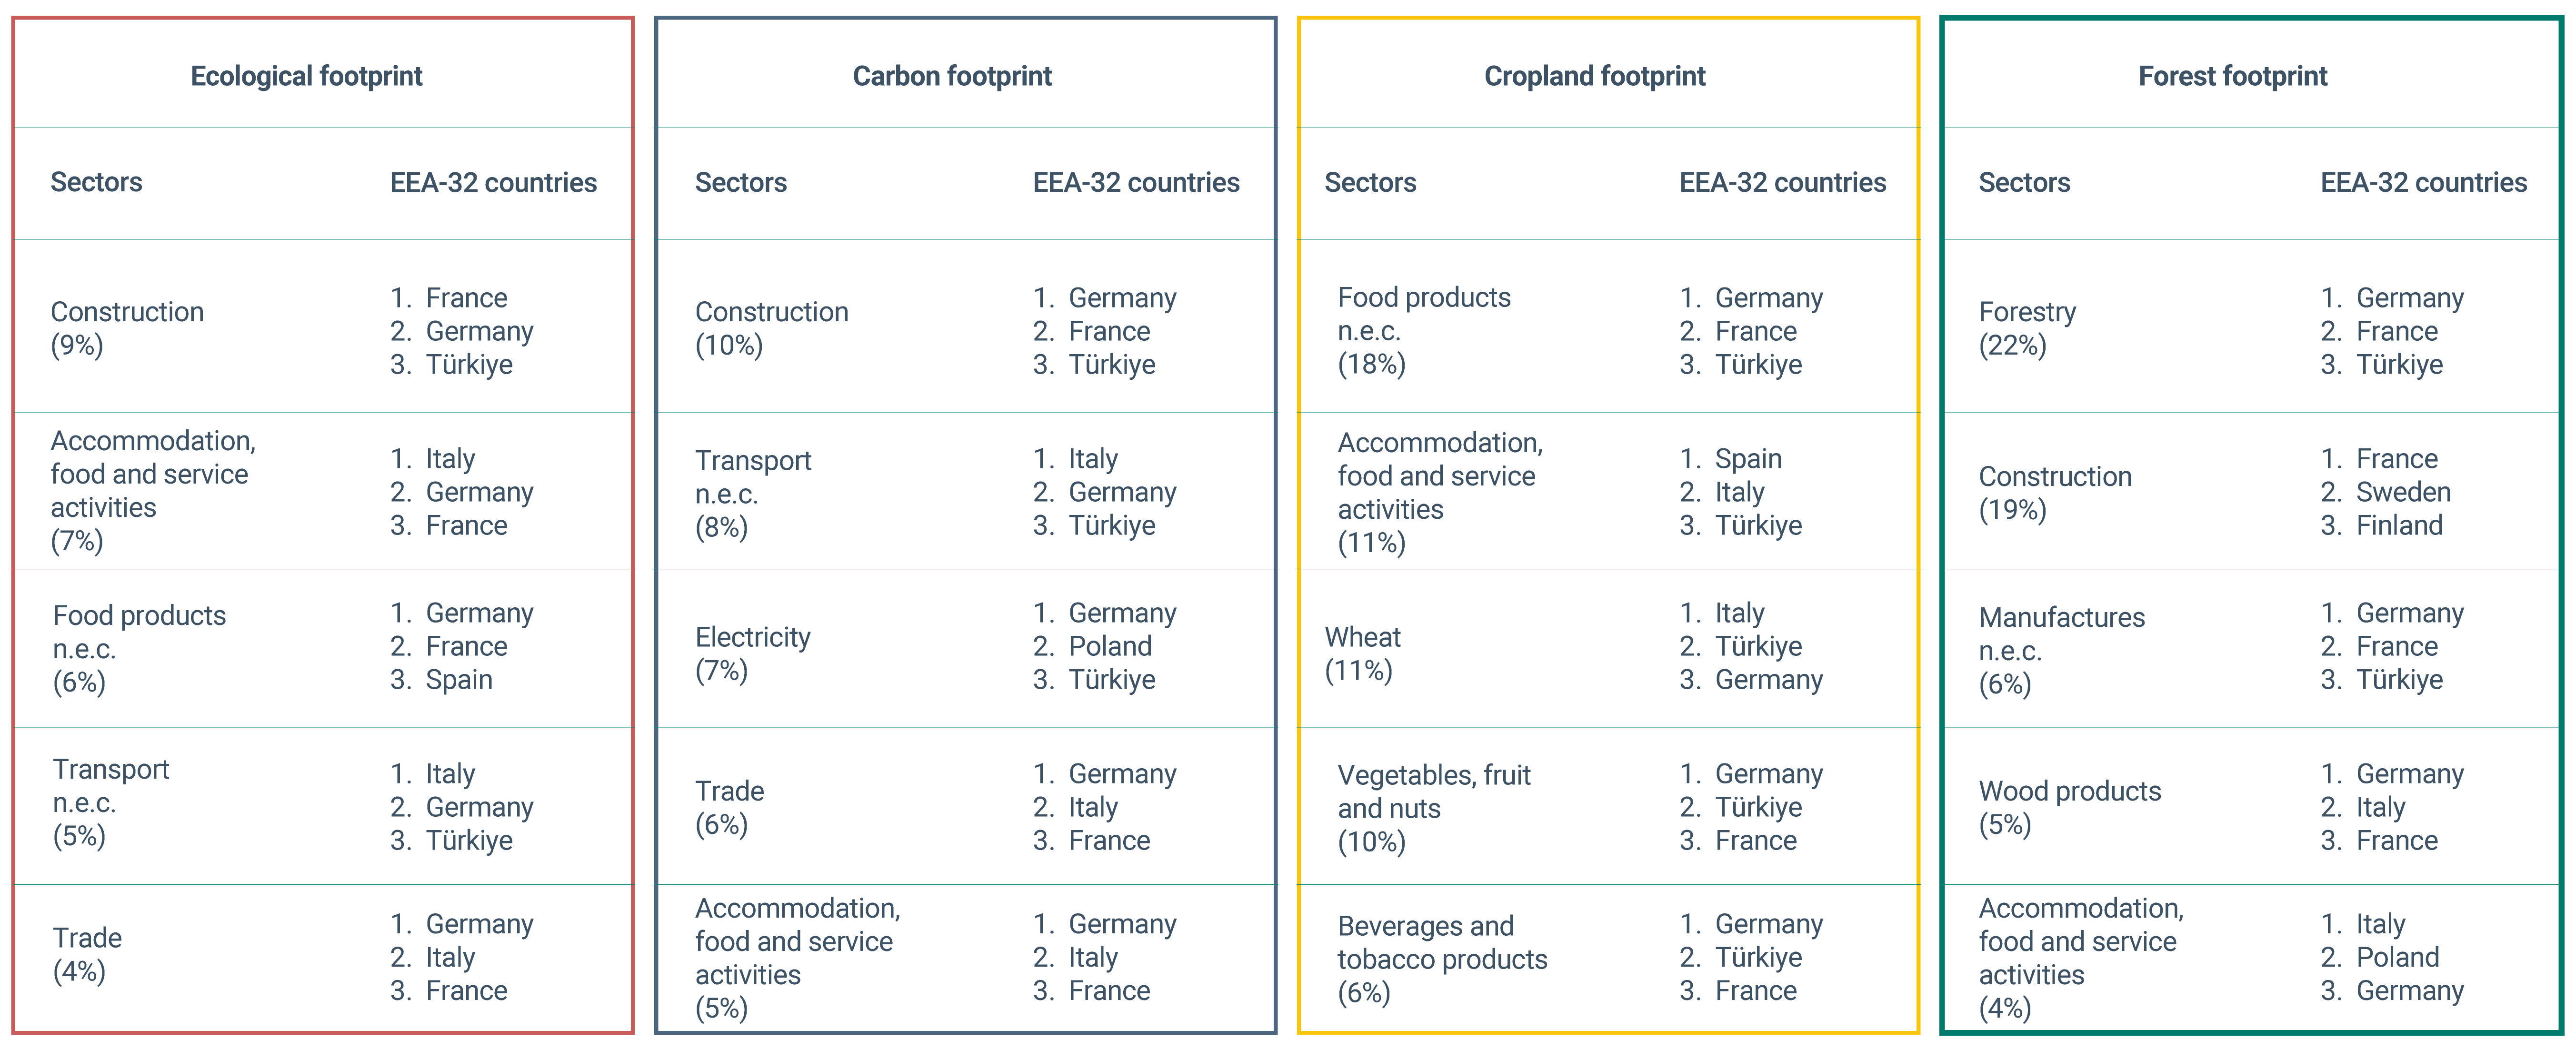
This table highlights the top five economic sectors contributing most to each footprint category in the EEA-32, along with their percentage share of the total footprint and the primary contributing countries. For further details on sectoral contributions and footprint values, see ETC BE, 2025.
n.e.c., = not elsewhere classified. This is used in economic databases to group activities that do not fit into more specific sector categories. For example, ‘“food products n.e.c.’” includes various food-related production processes not captured under more detailed classifications.
The ecological footprint (measured in global hectares - gha) combines the carbon, cropland, and forest footprints, along with the grazing land, built-up area, and fishing ground footprints, to measure the collective demand for biological resources and ecosystem services by each economic sector. In other words, each sector’s ecological footprint provides a measure of the ‘“appropriated biocapacity’” i.e. , that is the biocapacity needed to produce the primary resources that the sector uses, and to sequester the CO2 emissions that the sector releases in the environment. For more information see ETC BE, 2025.
The carbon footprint (measured in metric tonnes of CO2) accounts for the amount of CO2 emissions released into the environment by each economic sector. For more information see ETC BE, 2025.
The cropland footprint (measured in hectares, ha) quantifies the amount of arable land and permanent crops required to produce crop products (including livestock feed, fishmeal, oil crops and rubber) used by each economic sector. For more information see ETC BE, 2025.
The forest footprint (measured in hectares, ha) tracks the area of forests needed by each sector to supply fuelwood and timber for forest products. For more information see ETC BE, 2025.
Data sources
Metadata
More info
- Adapted from ETC BE, 2025