All official European Union website addresses are in the europa.eu domain.
See all EU institutions and bodies
An official website of the European Union | How do you know?
Environmental information systems
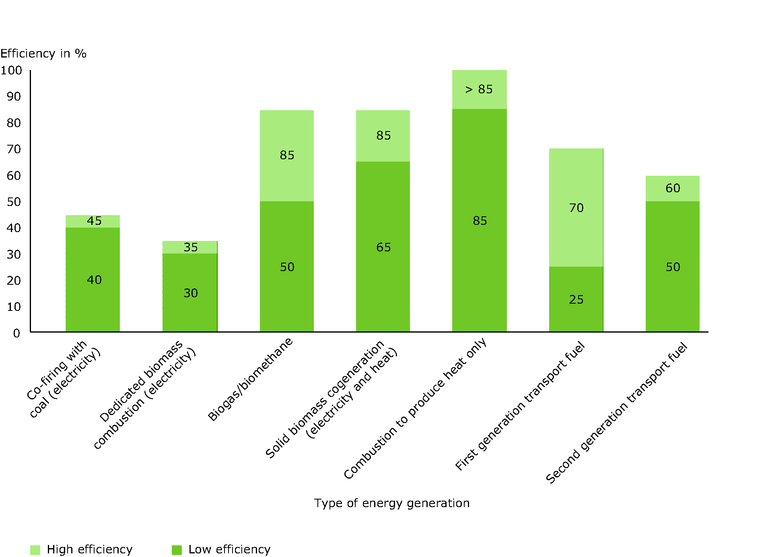
The figure provides a first overview of the relative efficiency of different types of bioenergy. Data represent net efficiencies taking into account results of life-cycle analysis.
Loading