All official European Union website addresses are in the europa.eu domain.
See all EU institutions and bodies
An official website of the European Union | How do you know?
Environmental information systems
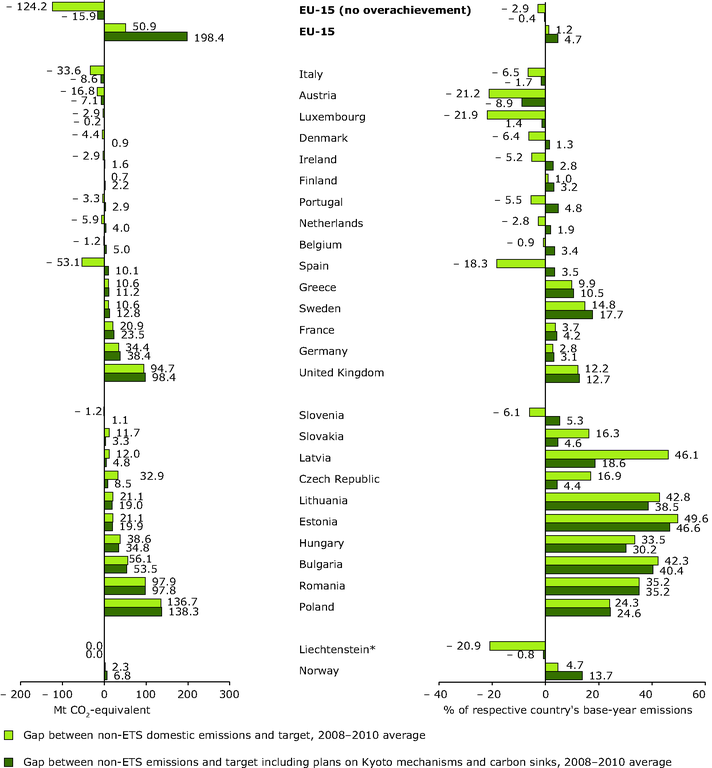
Gap between average 2008–2010 non‑ETS emissions and Kyoto targets (with and without the use of carbon sinks and flexible mechanisms)
Chart (static)
The gap refers to the average 2008–2009 non-ETS emissions because no approximated 2010 GHG emissions are available.
Downloads
Loading
Data sources
Metadata
- Greece
- Poland
- Romania
- Portugal
- Spain
- United Kingdom
- Netherlands
- Belgium
- Germany
- France
- Czechia
- Italy
- Cyprus
- Estonia
- Latvia
- Lithuania
- Finland
- Hungary
- Bulgaria
- Malta
- Denmark
- Sweden
- Austria
- Luxembourg
- Ireland
- Slovakia
- Slovenia
2008-2010
More info
Subsequent to the effect of allocation of allowances to the EU ETS, the target and annual emissions are those of the sectors not covered by the EU ETS. For each country, the top bar represents the gap between domestic emissions and the Kyoto target, while the bar below includes the planned effect of Kyoto mechanisms and carbon sinks. A positive value indicates a country for which average 2008 and 2009 non-ETS emissions were lower than the annual target. The assessment is based on average 2008–2010 emissions and the planned use of flexible mechanisms as well as the expected effect of LULUCF activities. EU-15 values are the sum of the gaps/surplus' for the 15 EU Member States which are part of the burden-sharing agreement. 'EU-15 (no overachievement)' corresponds to the situation of the EU-15 where all surplus AAUs from target overachievement in the EU-15 are not taken into account, to reflect the possibility that Member States with a surplus could use any remaining allowances for their own purposes and not necessarily make them available to compensate for Member States with a shortfall. Croatia, Iceland and Switzerland are not included as for these EEA member countries it is currently not possible to calculate non-ETS emissions.