All official European Union website addresses are in the europa.eu domain.
See all EU institutions and bodies
An official website of the European Union | How do you know?
Environmental information systems
Industrial releases of pollutants to air and economic activity in the EU-27, 2010-2020
Chart (static)
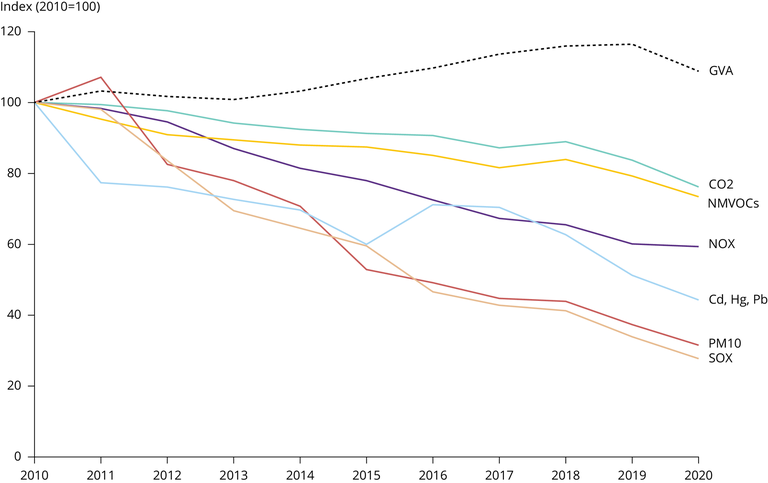
Economic activity represented by gross value added (GVA). CO2 = carbon dioxide. NMVOCs = non-methane volatile organic compounds. NOX = nitrogen oxides. Cd = cadmium. Hg = mercury. Pb = lead. PM10 = particles with an aerodynamic diameter less than or equal to a nominal 10 micrometres. SOX = sulphur oxides.
Downloads
Data sources
Metadata
More info
Loading
- Gross value added by A*10 industry - selected international annual data [NAIDA_10_A10__custom_2107129]
- Austria
- Belgium
- Bulgaria
- Croatia
- Cyprus
- Czechia
- Denmark
- Estonia
- Finland
- France
- Germany
- Greece
- Hungary
- Ireland
- Italy
- Latvia
- Lithuania
- Luxembourg
- Malta
- Netherlands
- Poland
- Portugal
- Romania
- Slovakia
- Slovenia
- Spain
- Sweden
2010-2020
Methodology
Pollutant releases reported under European Pollutant Release and Transfer Register/Large Combustion Plants (E-PRTR/LCP) dataflow for the relevant pollutant have been aggregated at EU-27 level and index against 2010 level has been calculated.
Additional information
GVA, gross value added; NMVOC, non-methane volatile organic compound; NOX, nitrogen oxides; PM10, particulate matter with a diameter of less than 10 μm; SOX, sulphur oxides. GVA is used as a proxy for the economic activity of industry in Europe, accounting for inflation, based on 2010 values.