next
previous
items

Figure

Development of the Gross Nitrogen Balance, Nitrogen use efficiency and GVA in the EU 28

Figure Created 11 Dec 2019 Published 13 Dec 2019 Last modified 13 Dec 2019
1 min read
Topics:
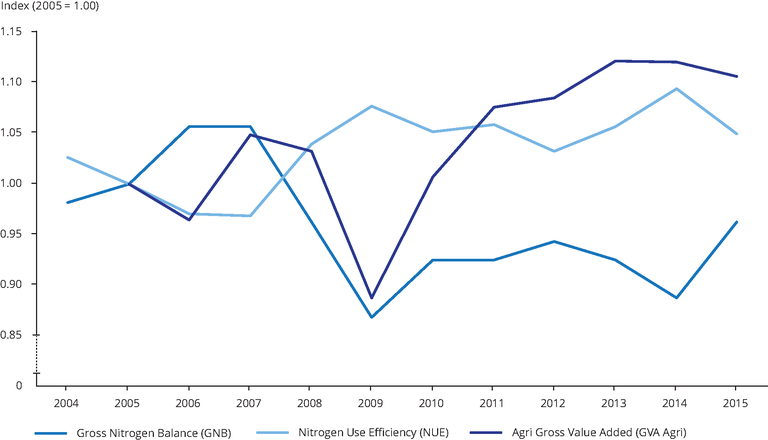
The graph shows the development of the Gross Nitrogen Balance (GNB) (kg nutrient/ ha Utilised Agricultural Area (UAA)) for the EU 28 over the period from 2004 to 2015, together with the nitrogen use efficiency (NUE) and GVA of the agricultural industry (values at current prices). For displaying all thre parameters and the development of their trends, an index is used setting 2005-values = 1

Metadata

Additional information

EEA calculations based on Eurostat data

GNB = Gross Nitrogen Balance, NUE = Nitrogen Use Efficiency, GVA (Agri) = Agri Gross Value Added (Agricultural industry)

GNB and NUE: based on Eurostat data (aei_pr_gnb) Eurostat estimates for Estonia (2015), RO and HR (2004 - 2014) BE, BG, DK, GR, IT, CY, LV, LT, LU, MT (2004 - 2015)

GVA of the agricultural industry (values at current prices): based on Eurostat data tag00056, Economic accounts for agriculture - values at current prices 

Permalinks

Geographic coverage

Temporal coverage

Topics

Topics:

Tags

Document Actions