All official European Union website addresses are in the europa.eu domain.
See all EU institutions and bodies
An official website of the European Union | How do you know?
Environmental information systems
Number of Member States that had met their national emissions reduction commitments for the five key pollutants for 2030 and beyond in 2020, and number of Member States that need to reduce emission levels to meet their commitments
Chart (static)
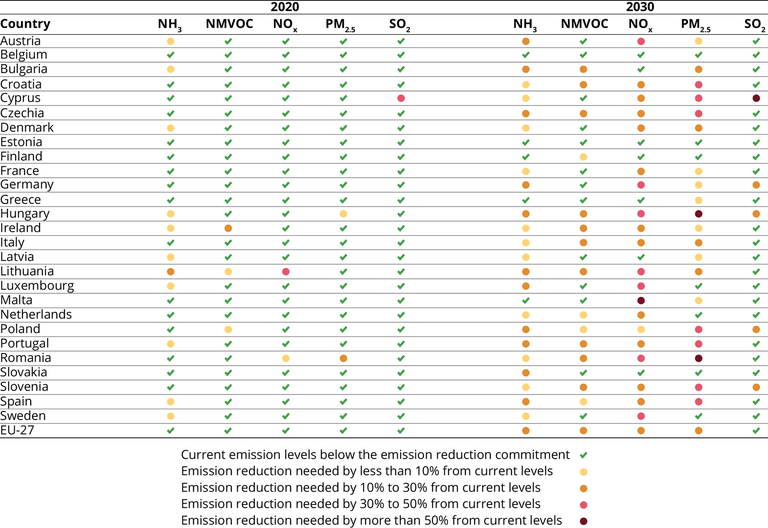
1This information is based on data provided by Member States, not yet checked by the European Commission. The numbers are subject to change in relation to the results of the NEC directive inventory review.
2The NEC directive (Article 5) establishes a process that allows Member States to ‘adjust’ their emission inventories downwards for compliance checking. This can take place when the failure to comply with the national emission reduction commitments is the result of Member States having applied improved emission inventory methods that have been updated in accordance with the latest scientific knowledge having become available since the reduction commitments were originally set. Ireland has submitted a flexibility application in 2022 for an inventory adjustment in relation to NMVOC. This application is not taken into account in this current assessment. If approved, it could bring Ireland into compliance for NMVOC.
Downloads
Data sources
Metadata
More info
Loading
- Austria
- Belgium
- Bulgaria
- Croatia
- Cyprus
- Czechia
- Denmark
- Estonia
- Finland
- France
- Germany
- Greece
- Hungary
- Ireland
- Italy
- Latvia
- Lithuania
- Luxembourg
- Malta
- Netherlands
- Poland
- Portugal
- Romania
- Slovakia
- Slovenia
- Spain
- Sweden
2020