next
previous
items

Figure

Status of fish stocks in the International Council for the Exploration of the Sea (ICES) and General Fisheries Commission for the Mediterranean (GFCM) fishing regions of Europe

Figure Created 08 Nov 2010 Published 08 Nov 2010 Last modified 15 Dec 2022
1 min read
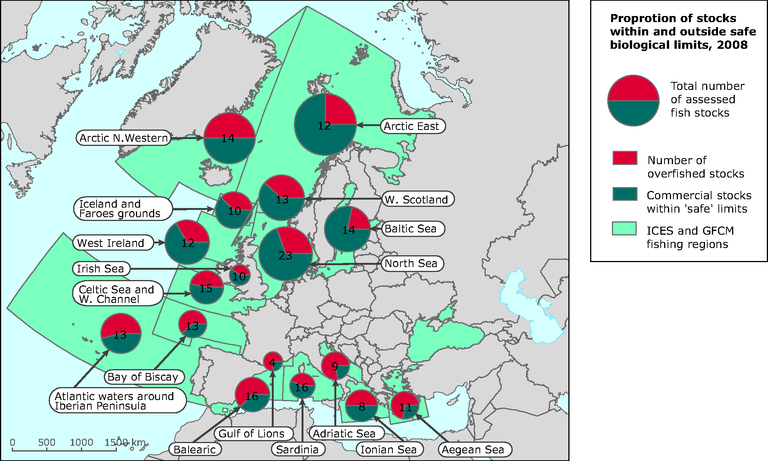
The chart shows the proportion of assessed stocks that are overfished (red) and stocks within safe biological limits (blue). The numbers in the circles indicate the number of stocks assessed within the given region. The size of the circles is proportional to the magnitude of the regional catch.

Download

Metadata

Additional information

Number in circle is the number of stocks assessed within the given region. The size of the circles is scaled proportional to the magnitude of the regional catch
Geographical coverage note: Baltic Sea, North Sea, West Scotland, Irish Sea, West Ireland, Celtic Sea Western Channel, Iberian peninsuala, Bay of Biscay, Arctic, Balearic, Gulf of Lions, Sardinia, Adriatic Sea, Ionian Sea, Aegean Sea, Crete, Tunas, Black Sea

Permalinks

Geographic coverage

Temporal coverage

Tags

Filed under: fish stock, protected areas
Document Actions