All official European Union website addresses are in the europa.eu domain.
See all EU institutions and bodies
An official website of the European Union | How do you know?
Environmental information systems
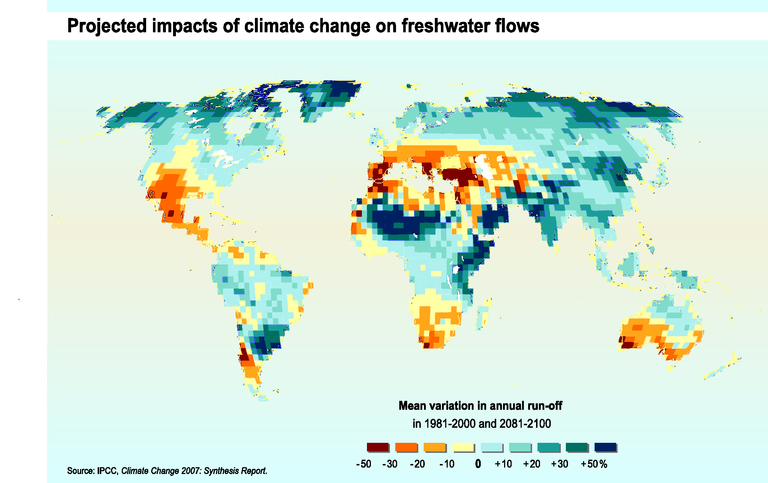
The map shows mean variation in annual run-off in 1981-2000 and 2081-2100
Loading