All official European Union website addresses are in the europa.eu domain.
See all EU institutions and bodies
An official website of the European Union | How do you know?
Environmental information systems
Development of the circular material use rate and its main components, EU-27, 2004-2021
Chart (static)
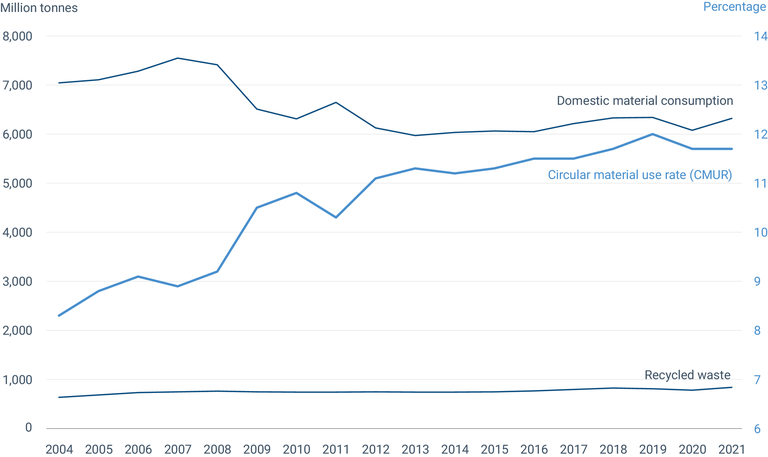
Missing data for odd years for recycled waste are linearly interpolated.
Downloads
Data sources
Metadata
More info
Loading
- ‘Material flow accounts (env_ac_mfa)’, Eurostat Data Browser, Eurostat, 2022
- Austria
- Belgium
- Bulgaria
- Croatia
- Cyprus
- Czechia
- Denmark
- Estonia
- Finland
- France
- Germany
- Greece
- Hungary
- Ireland
- Italy
- Latvia
- Lithuania
- Luxembourg
- Malta
- Netherlands
- Poland
- Portugal
- Romania
- Slovakia
- Slovenia
- Spain
- Sweden
2004-2021