All official European Union website addresses are in the europa.eu domain.
See all EU institutions and bodies
An official website of the European Union | How do you know?
Environmental information systems
Localisation of the 211 facilities accounting for 50 % of the aggregate damage costs from main air pollutants and greenhouse gases (2017)
Map (static)
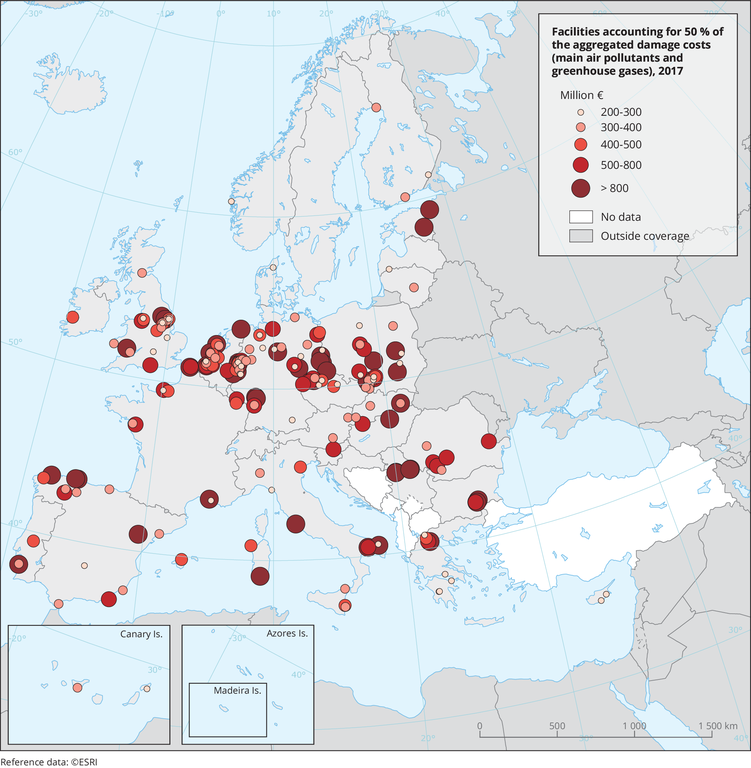
Mortality valued using the value of a life year (VOLY). Euro price base: 2019
Downloads
Data sources
Metadata
More info
Loading
- 2021, ETC/ATNI
- Austria
- Belgium
- Bulgaria
- Croatia
- Cyprus
- Czechia
- Denmark
- Estonia
- Finland
- France
- Germany
- Greece
- Hungary
- Iceland
- Ireland
- Italy
- Latvia
- Liechtenstein
- Lithuania
- Luxembourg
- Malta
- Netherlands
- Norway
- Poland
- Portugal
- Romania
- Serbia
- Slovakia
- Slovenia
- Spain
- Sweden
- Switzerland
- United Kingdom
2017
Additional information
VOLY refers to the fact that in this estimate mortality due to exposure to the main air pollutants is estimated in terms of life years lost and valued by the value of a life year (VOLY). In an alternative higher estimate mortality is estimated in terms of premature deaths and monetised with the value of statistical life (VSL). Facilities considered in this estimate have been those reporting emissions of the main air pollutants and greenhouse gases to the European Pollutant Release and Transfer Register (E-PRTR) in 2017.