All official European Union website addresses are in the europa.eu domain.
See all EU institutions and bodies
An official website of the European Union | How do you know?
Environmental information systems
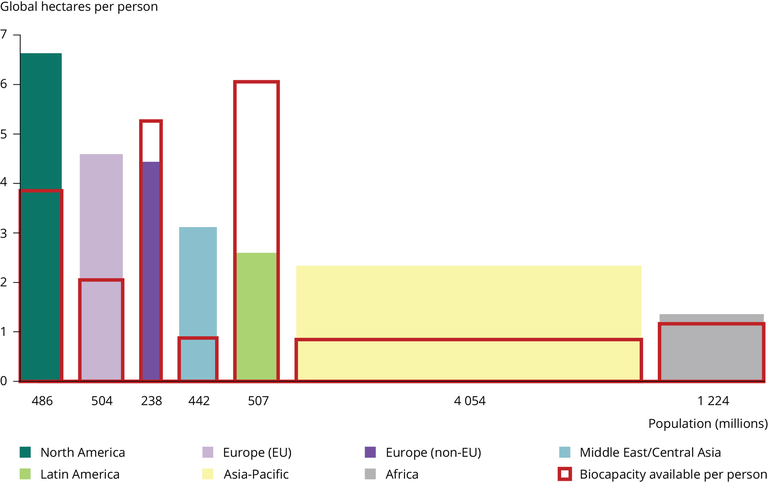
The areas of the coloured bars show the total ecological footprint of each region in 2016. They are the product of the per person ecological footprint and the population of each region. The biocapacity of each region is represented by the area within the red lines; the height shows the per capita biocapacity.
Loading