All official European Union website addresses are in the europa.eu domain.
See all EU institutions and bodies
An official website of the European Union | How do you know?
Environmental information systems
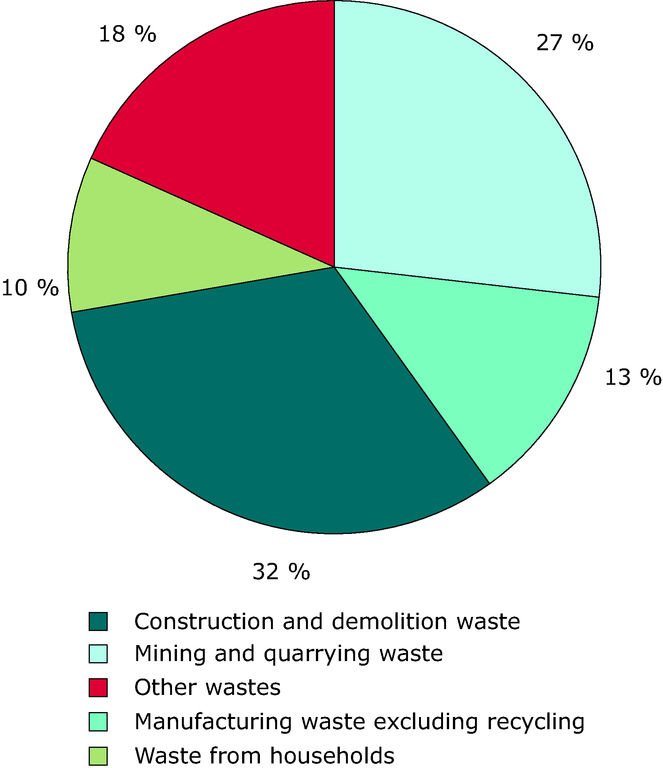
This figure shows the total waste generation distribution in percentages between different sources in the EU, EFTA, Croatia and Turkey in 2008
Loading