next
previous
items

Figure

Temporal development of the ratio of the number of Lusitanian species to the number of Boreal species

Figure Created 07 Feb 2024 Published 16 Feb 2024 Last modified 21 Mar 2024
1 min read
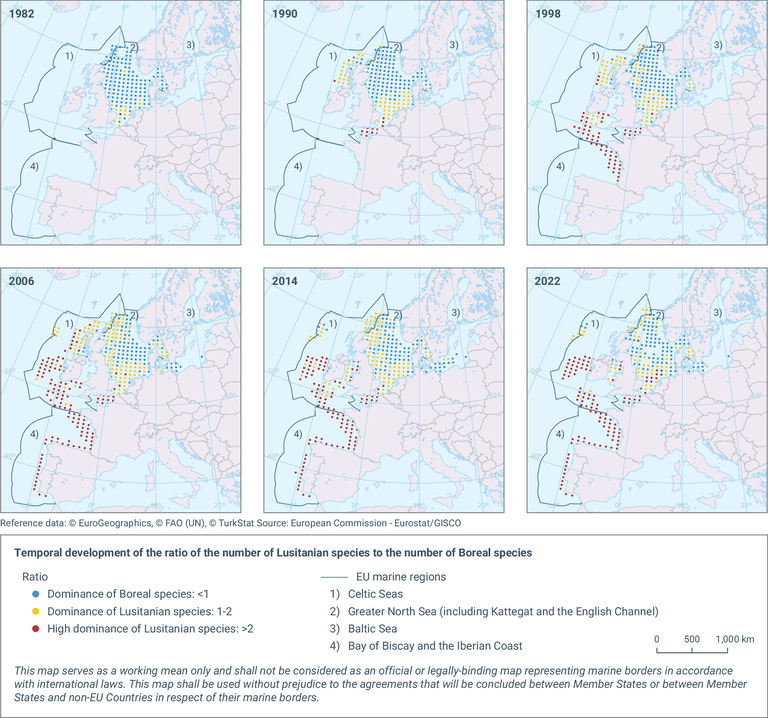
The maps show the temporal development of the ratio between the number of warm-favouring (Lusitanian) fish species and the number of cool-favouring (Boreal) fish species by The International Council for the Exploration of the Sea (ICES) statistical area in 8-year intervals from 1982 to 2022.

European data

Metadata

Additional information

Map animation: Temporal development of the Lusitanian/Boreal species ratio by year and statistical rectangle, 1967-2022-European Environment Agency (europa.eu).(https://www.eea.europa.eu/data-and-maps/explore-interactive-maps/temporal-development-of-the-lusitanian)


Geographical coverage
Marine Strategy Framework Directive (MSFD) regions and sub-regions: Baltic Sea, Celtic Seas, Greater North Sea, Bay of Biscay and the Iberian Coast.

Permalinks

Geographic coverage

Temporal coverage

Document Actions