All official European Union website addresses are in the europa.eu domain.
See all EU institutions and bodies
An official website of the European Union | How do you know?
Environmental information systems
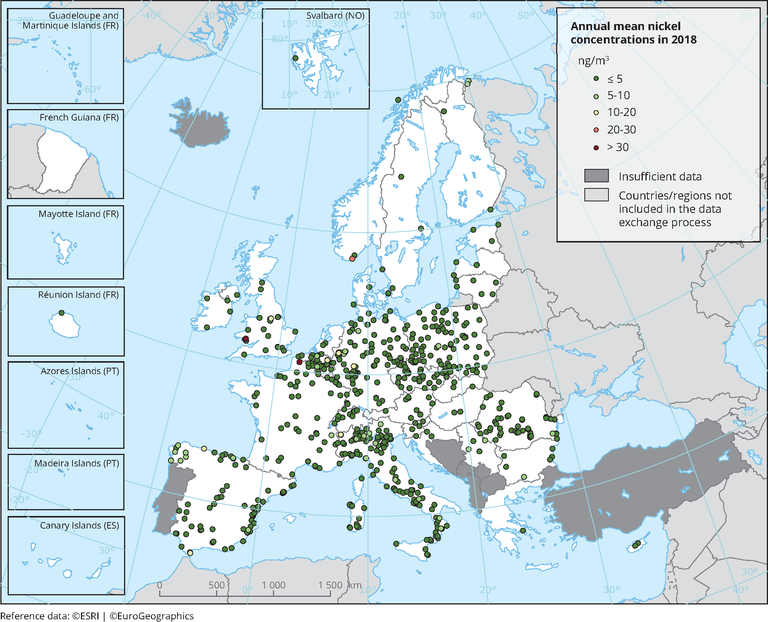
Observed concentrations of Ni in 2018. Dots in the last two colour categories correspond to concentrations above the target value. Only stations reporting more than 14 % of valid data have been included in the map.
Loading