All official European Union website addresses are in the europa.eu domain.
See all EU institutions and bodies
An official website of the European Union | How do you know?
Environmental information systems
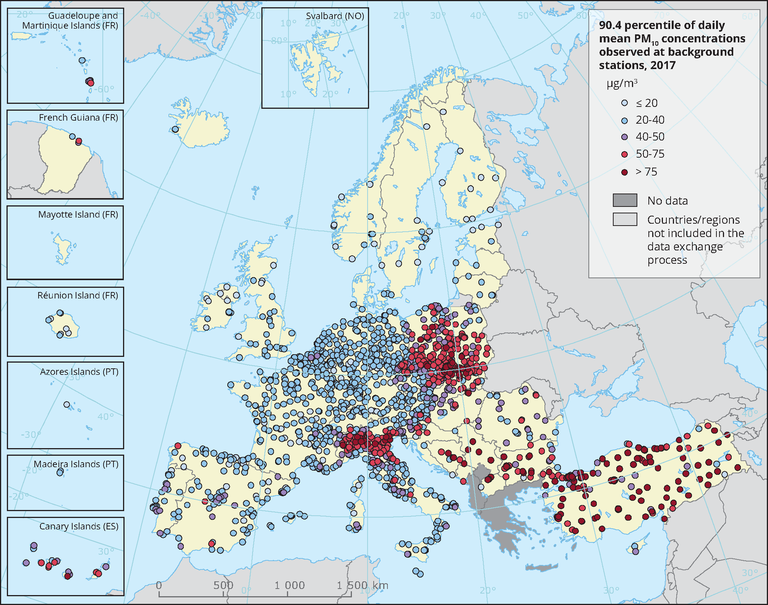
The map shows the Percentile 90.4 of daily mean PM10 concentrations at background stations. This represents the 36th highest value in a complete series. It is related to the PM10 daily limit value, which allows 35 exceedances of the 50 μg/m3 threshold over a 1-year period. Dots in the last two colour categories indicate stations with exceedances of this daily limit value. Only stations for which more than 75 % of data are valid have been included in the map.