All official European Union website addresses are in the europa.eu domain.
See all EU institutions and bodies
An official website of the European Union | How do you know?
Environmental information systems
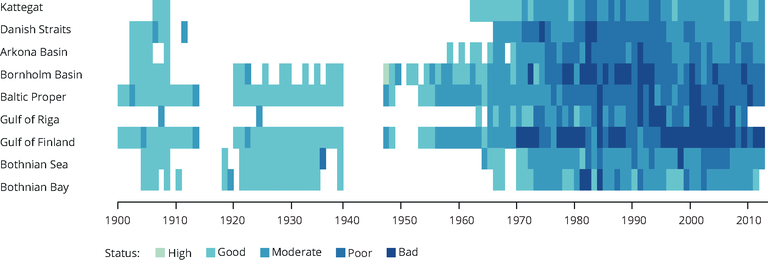
The chart shows the annual classified Eutrophication status in each of 9 basins of the Baltic Sea over the period from 1901 to 2012. The status is assigned one of five classes "High", "Good", "Moderate", "Poor" or "Bad", depending on the Eutrophcation Ratio calculated by the HEAT tool. See more details in Andersen et al. (2015) Biol. Rev. 1 doi: 10.1111/brv.12221
Loading