All official European Union website addresses are in the europa.eu domain.
See all EU institutions and bodies
An official website of the European Union | How do you know?
Environmental information systems
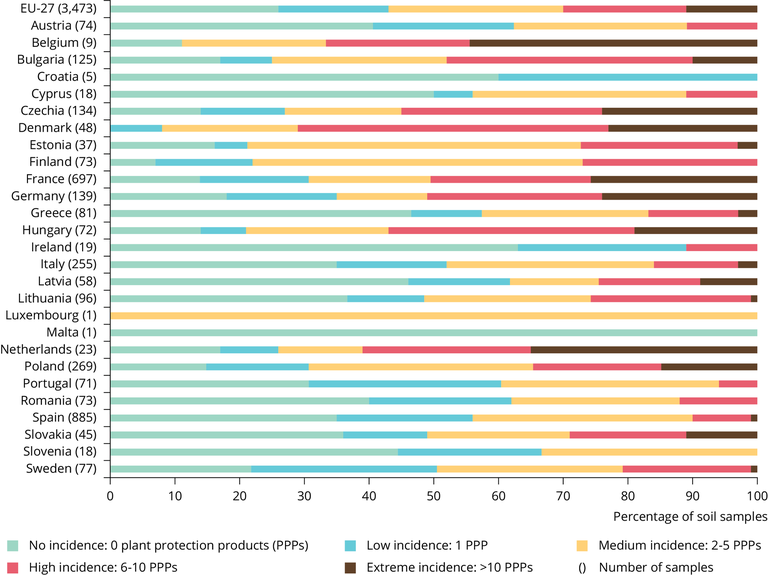
The figure shows the percentage of soil samples for each country with a specified number of detections of pesticides, based on analysis of 118 different pesticides in the samples.
Loading