All official European Union website addresses are in the europa.eu domain.
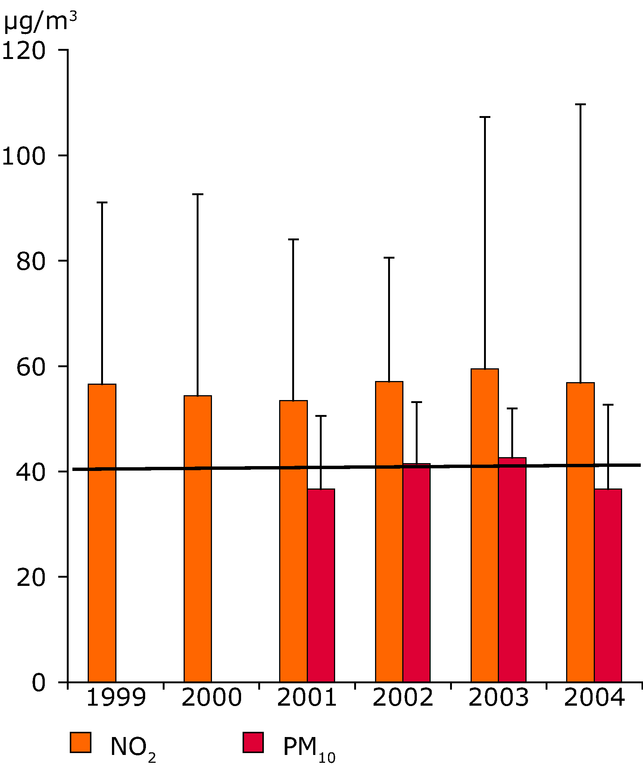
See all EU institutions and bodiesBars represent average annual concentrations over a limited number of monitoring stations along busy roads in major European cities (Vienna, Bruxelles, Prague, Helsinki, Paris, Berlin, Athens, Krakow, Bratislava, Stockholm and London), error bars represent the highest annual concentration measured at one single monitoring station
Loading

