All official European Union website addresses are in the europa.eu domain.
See all EU institutions and bodies
An official website of the European Union | How do you know?
Environmental information systems
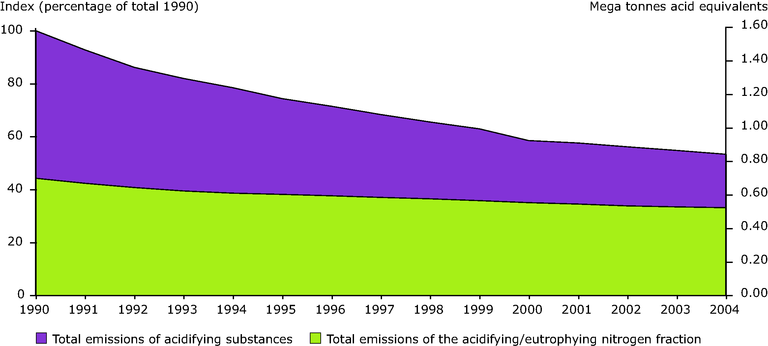
How to read the graph: in 1990, the total of acidifying emissions was around 1 500 Gg, while for nitrogen fractions it was more than 500 Gg.
Loading