All official European Union website addresses are in the europa.eu domain.
See all EU institutions and bodies
An official website of the European Union | How do you know?
Environmental information systems
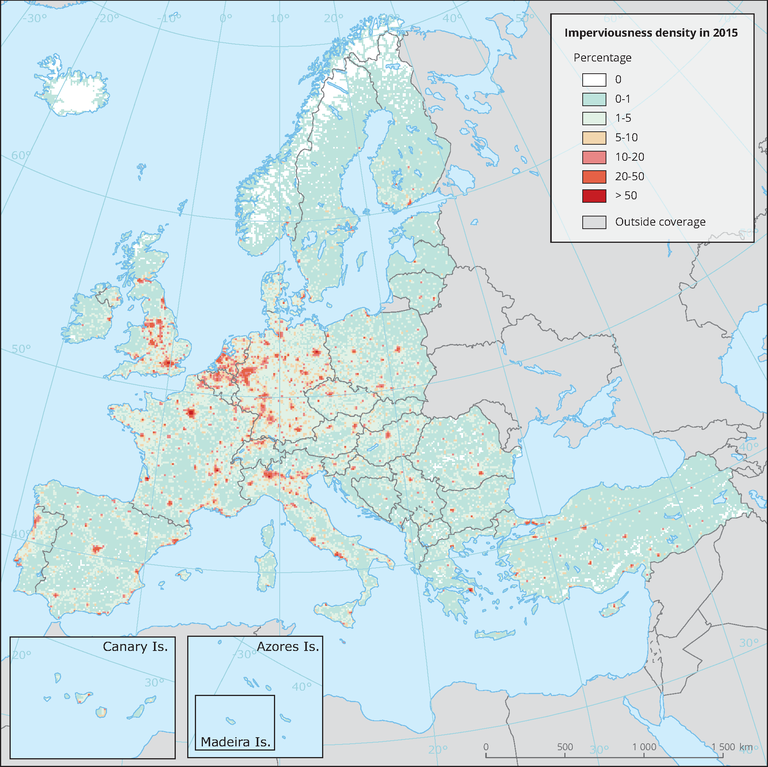
The map shows the density of soil sealing in 2012, based on a 10 km2 reference grid. Green and light orange colors show areas with no or very limited sealing, while red and dark red colors show highly to fully sealed grid cells (mainly urban areas).
Loading