next
previous
items

Figure

Traffic related toxics (2004): Distance to target for lead and carbon monoxide at urban and traffic stations

Figure Created 12 Nov 2009 Published 12 Nov 2009 Last modified 29 Nov 2012
1 min read
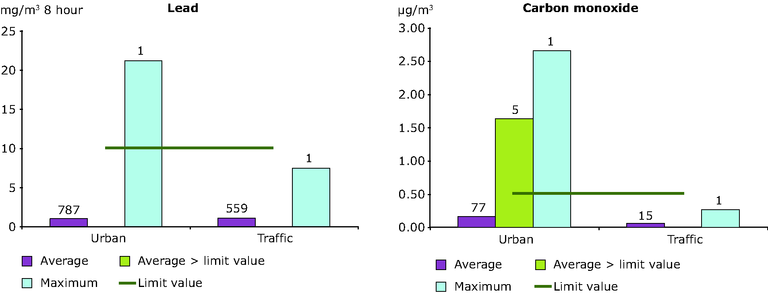
The limit value is shown as a bold line, with observed concentrations as columns

Download

Metadata

Additional information

´Average´ is average across all stations, ´average´ > limit value´ is average of those stations exceeding the limit value, ´maximum´ is the maximum station. Numbers indicate numbers of stations in each category.

Permalinks

Geographic coverage

Document Actions