All official European Union website addresses are in the europa.eu domain.
See all EU institutions and bodies
An official website of the European Union | How do you know?
Environmental information systems
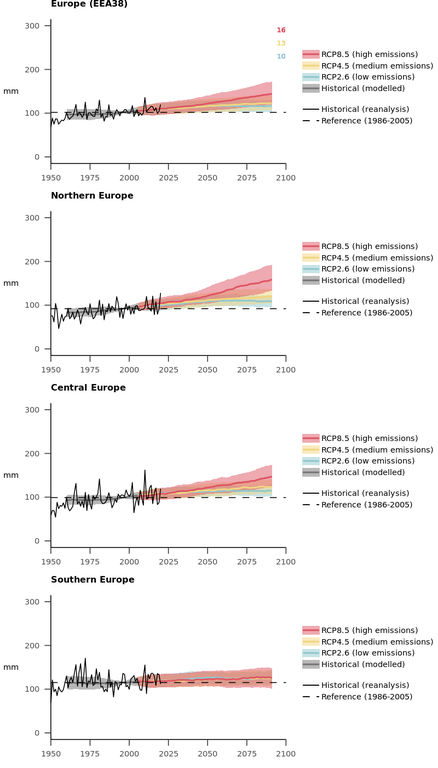
The extreme precipitation total index represents the total precipitation on all days with heavy precipitation, defined as exceeding the 99th percentile of daily precipitation over the reference period. Therefore, it accounts for both the frequency and magnitude of unusual precipitation events identified with respect to the baseline conditions. Other implementations of this index may use a different percentile (e.g., 95th) depending on the level of rarity of events to be considered.
Loading