All official European Union website addresses are in the europa.eu domain.
See all EU institutions and bodies
An official website of the European Union | How do you know?
Environmental information systems
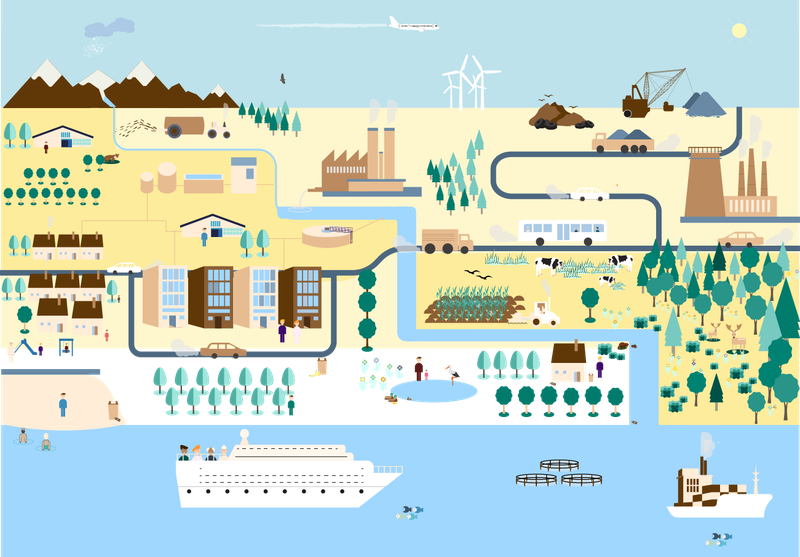
The zero pollution action plan is a cornerstone of the EU’s ambitions to improve the well-being and health of citizens and future generations under the European Green Deal. It sets out the vision that by 2050, the EU should have reduced pollution to the extent that it no longer harms human health and natural ecosystems. This is translated into key 2030 targets to speed up reducing pollution at source. The European Environment Agency has produced this zero pollution monitoring assessment to assess progress towards these targets and to support the Commission in the delivery of the long-term vision of a non-toxic environment.
Key messages
Good progress has been made towards reducing air pollution from industry, transport and homes — reducing the number of deaths linked to air pollution as a result. At the same time, Europe has been maintaining and improving its bathing and drinking water quality and reducing the risk of antimicrobial resistance. Encouraging trends are also taking place in reducing pesticide use, although the resulting positive impact on the environment is yet to be seen.
Progress is slower in other areas:
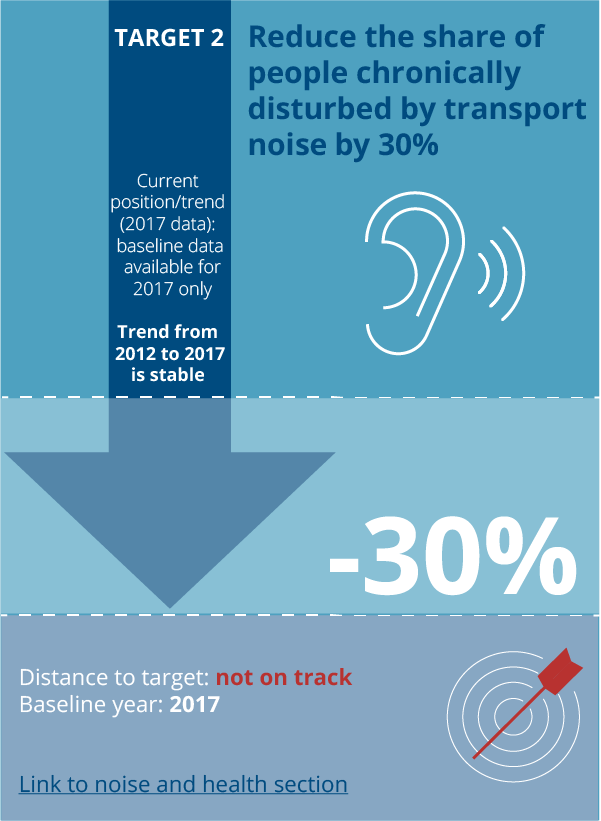
Noise from transport continues to harm health, with little progress made towards reducing noise levels.
Preventing excess nutrients and persistent chemicals from harming Europe’s freshwater and marine ecosystems is proving to be a significant challenge.
Efforts to reduce waste have delivered limited results to date. Europe’s present systems of production and consumption are a barrier to a more sustainable and circular economy.
Several emerging issues can be identified, even if evidence is not available for all EU countries:
An increasing body of evidence demonstrates that citizens’ health is being adversely affected by hazardous chemicals that pollute our bodies.
Growing evidence of soil pollution highlights the long-term damage being done to ecosystems that are crucial for healthy food and biodiversity.
Light pollution, which affects nocturnal species, is another potential area of concern where there are currently few or no legislative controls.
There are clear inequalities in terms of exposure to pollution. People in lower socio-economic groups are more affected by air pollution, while noise disproportionately impacts those living in urban areas. Children are also particularly vulnerable to the effects of air pollution and chemicals.
While Europe is making important progress towards its 2050 ambition of reducing pollution to levels no longer harmful to health and natural ecosystems, further efforts will be needed to eliminate all negative impacts. Several new policy proposals are currently under consideration that have the potential to accelerate progress towards this ambition.
Introduction
To measure progress towards the zero pollution action plan’s targets and vision and understand the likelihood of achieving them, robust monitoring and outlook mechanisms must be in place. Consequently, a monitoring and outlook framework was established under the zero pollution action plan.
The EEA is responsible for delivering the zero pollution monitoring assessment and supporting policy implementation through its ongoing monitoring and reporting on the state of the European environment. The Agency also monitors and reports more broadly on progress towards wider environmental and climate policy objectives. The European Commission Joint Research Centre (JRC) has delivered the zero pollution outlook report, which takes a forward looking perspective in assessing the likelihood of the EU meeting the zero pollution targets.
This first zero pollution monitoring and outlook assessment serves as a baseline. Together with future assessments, it will support the Commission and Member States in assessing progress towards the zero pollution targets. It will also inform future policies designed to support the zero pollution ambition.
Download a summary zero pollution monitoring assessment report here, in pdf format.
The zero pollution action plan
Accompanying resources
EEA’s zero pollution monitoring assessment is one of three products which together provide the monitoring, outlook and policy perspectives. The other products are:
- The overarching zero pollution monitoring and outlook report prepared by the European Commission, Directorate-General for Environment.
- The zero pollution outlook report, completed by the European Commission Joint Research Centre.
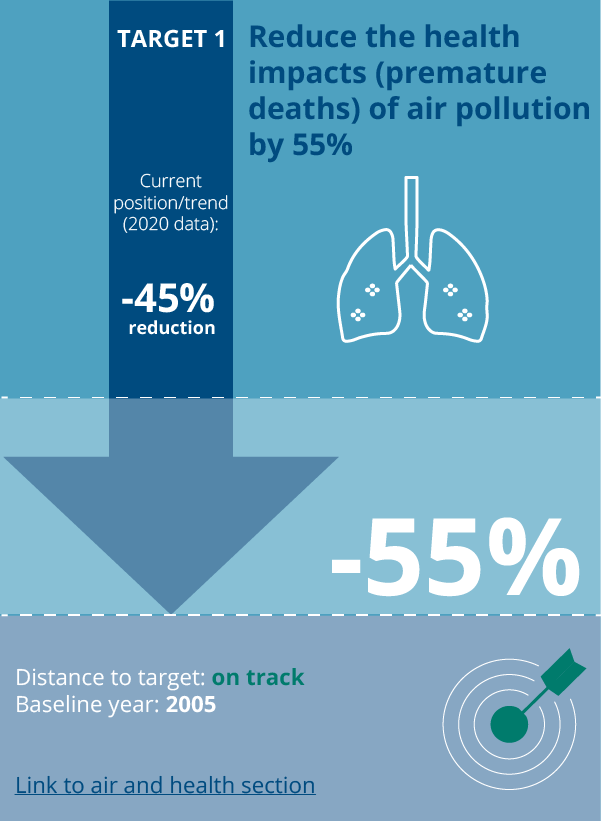
Progress towards the zero pollution targets
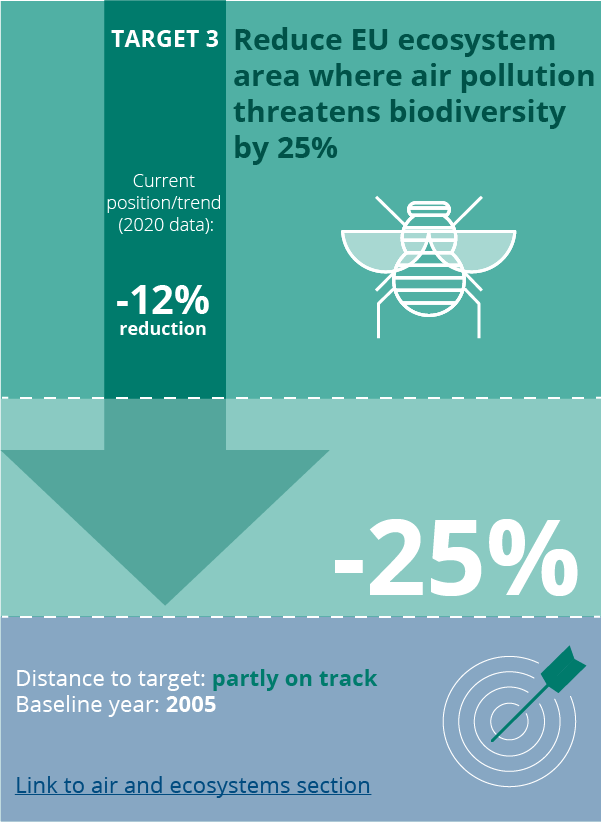
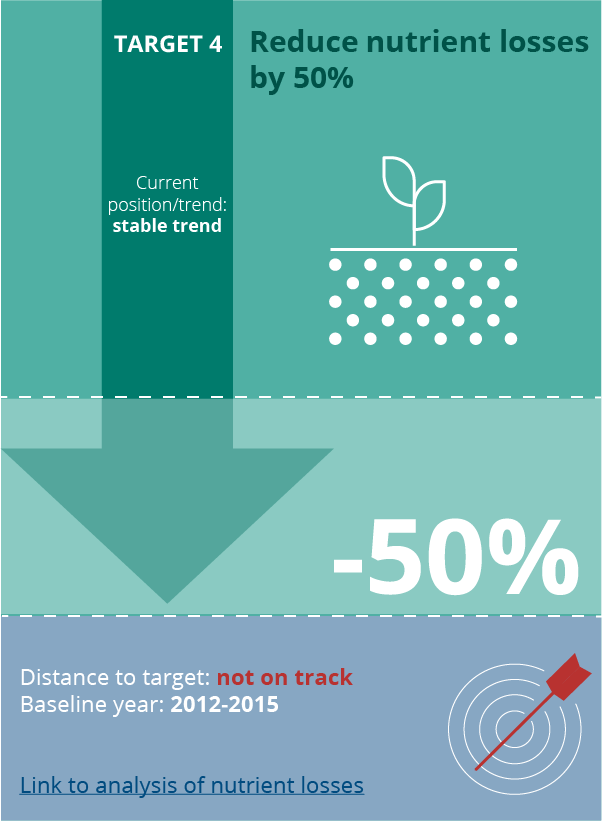
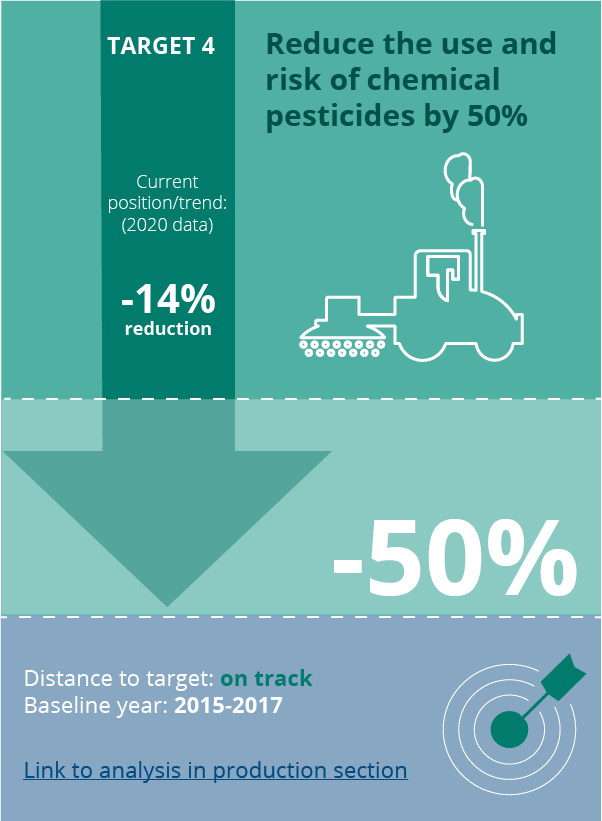
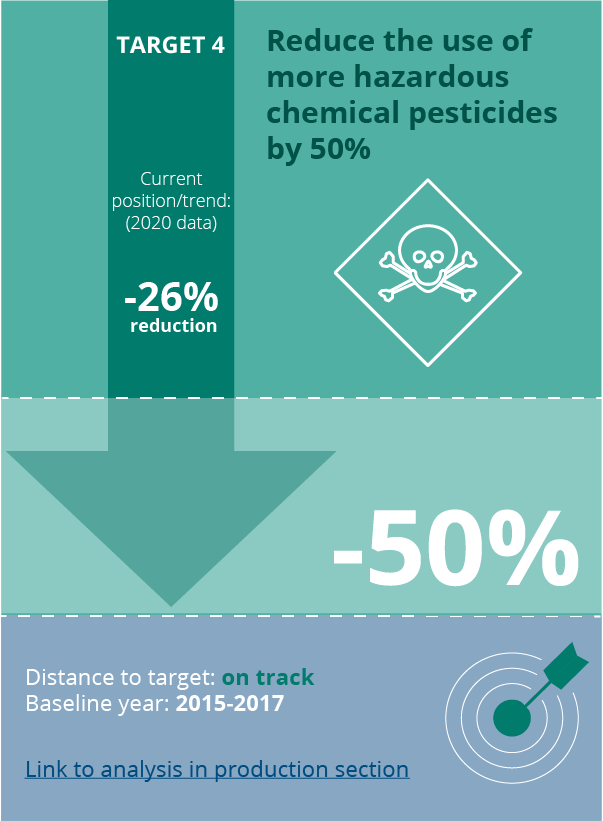
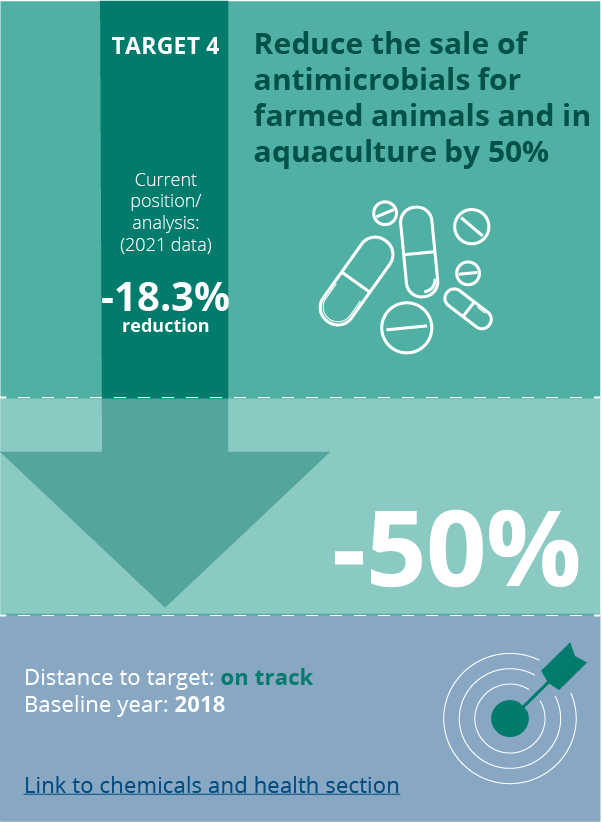
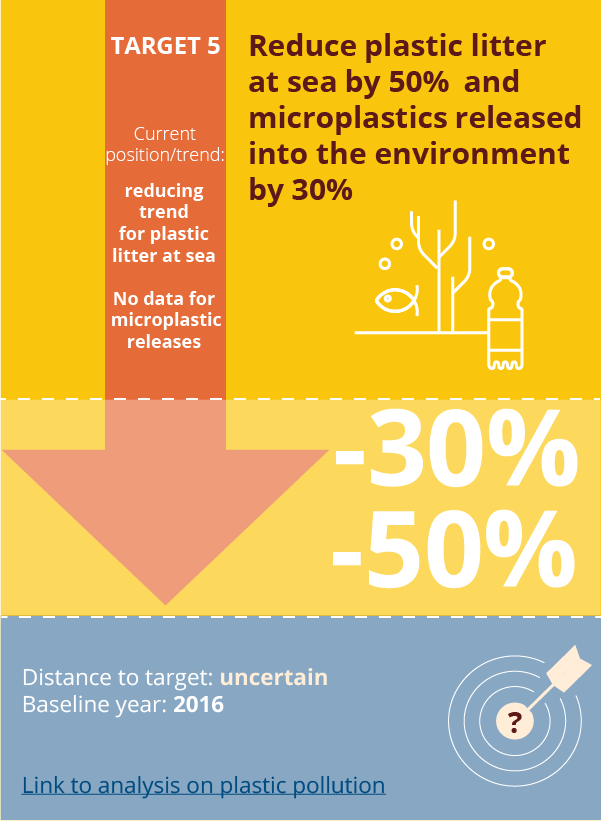
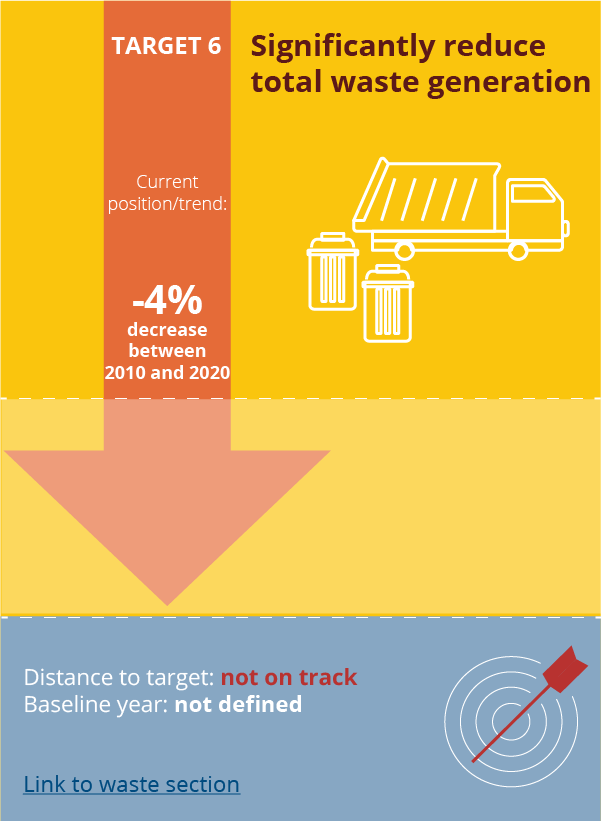
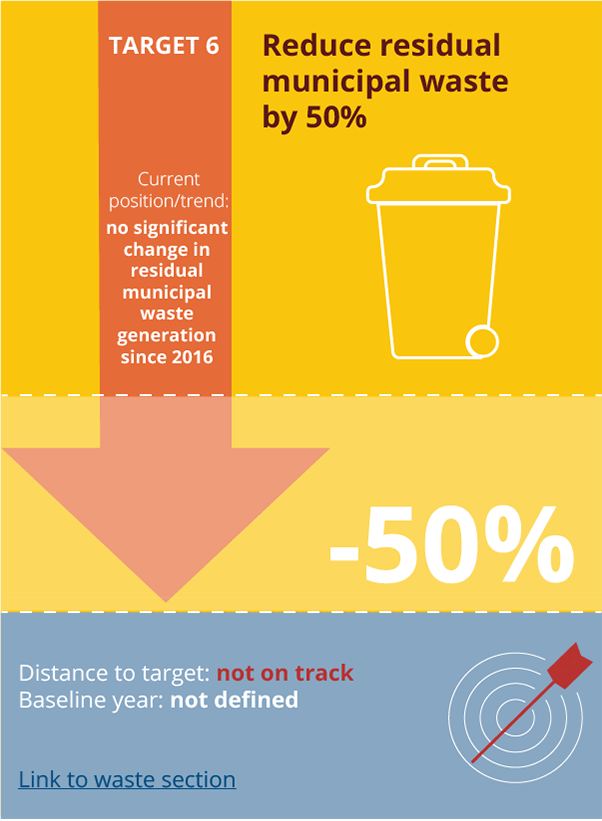
The zero pollution action plan lists a number of targets to be achieved by 2030. Progress towards these targets is presented below based on past trends. The current ‘distance to target’ is also presented - an assessment of the likelihood of achieving the target based on current status and recent trends. The distance to target is categorised on the following basis:
- On track: extrapolation of past trends suggests that the target will likely be met.
- Mostly on track: extrapolation of past trends suggests the target will be close to being met.
- Partly on track: extrapolation of past trends suggests progress will be made towards the target, but the target will not be met.
- Not on track: extrapolation of past trends indicates limited or no progress, the target will not be met.
- Uncertain: lack of clear evidence due to knowledge gaps.
An element of expert judgement is also used where there are uncertainties in the available evidence. For further information please click on the target card.
Next steps
The EEA’s zero pollution monitoring assessment provides the first review of progress towards the zero pollution targets and vision. The aim of this assessment is to benchmark progress and support the European Commission and Member States in identifying areas where further measures are needed to deliver the zero pollution targets and vision.
A second monitoring and outlook assessment will be published in 2024, to review progress and revisit the most persistent barriers to achieving the zero pollution targets and vision.
Other useful resources:
The following resources also provide useful information on the zero pollution action plan:
- Horizon projects supporting the zero pollution action plan published by the European Commission, Directorate-General for Research and Innovation;
- The EU environment foresight system (FORENV) report on emerging issues impacting the delivery of a zero-pollution ambition by 2050;
- Report from the German Environment Agency (UBA) on the zero pollution action plan as a chance for a cross-regulatory approach to pollution prevention and reduction;
- EEA Signals 2020 report – towards zero pollution in Europe.
EEA Web report no. 03/2022
Title: Zero pollution monitoring assessment
HTML - TH-08-22-306-EN-Q - ISBN 978-92-9480-514-0 - doi: 10.2800/515047