All official European Union website addresses are in the europa.eu domain.
See all EU institutions and bodies
An official website of the European Union | How do you know?
Environmental information systems
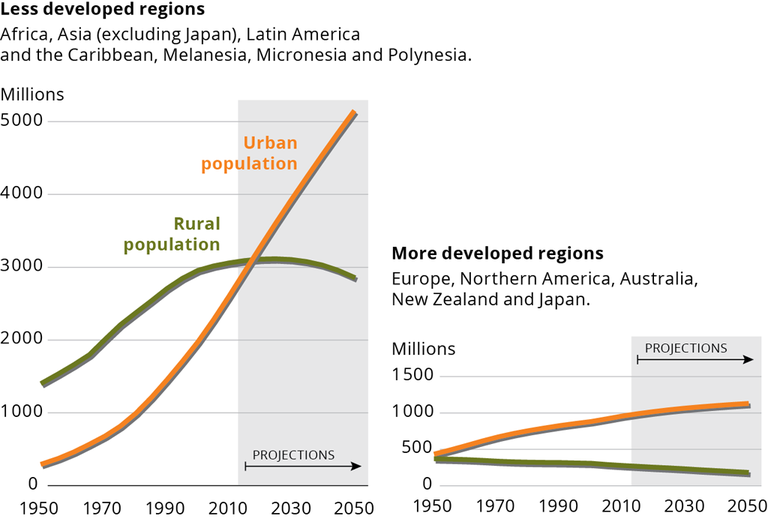
The figure shows changes of urban vs. rural population shares, as observed from 1950 to 2010, and projected until 2050
Loading