All official European Union website addresses are in the europa.eu domain.
See all EU institutions and bodies
An official website of the European Union | How do you know?
Environmental information systems
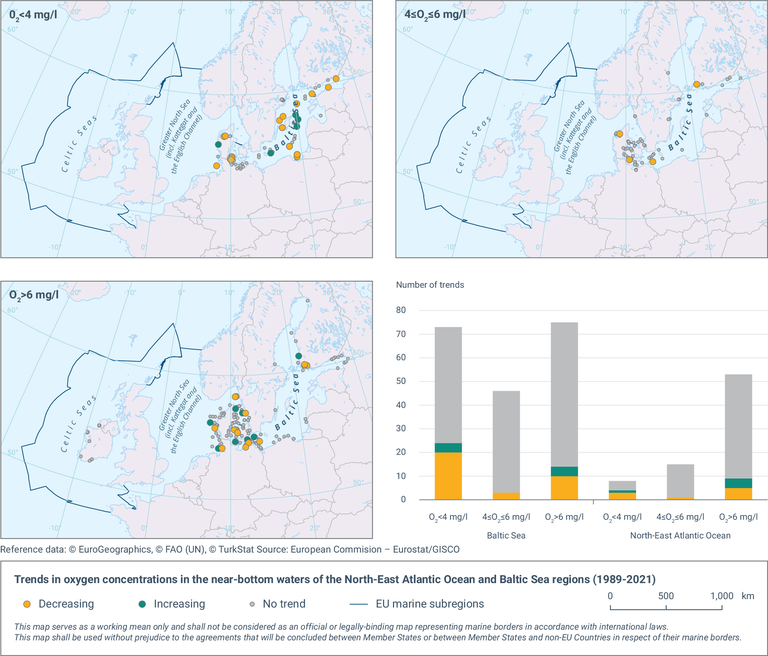
The maps show trends in annual 25-percentile of oxygen concentrations in near-bottom waters at stations with at least 6 years of observations in the period 1989-2021, and the number of trends for the North-East Atlantic and Baltic Sea, by three classes of DO concentrations: <4mg/l (including <2mg/l class); 4-6mg/l and >6mg/l. Only trends for time series ending after 2000 are included.
The chart shows the number of time series with increasing trend/no trend/decreasing trend in the North-East Atlantic Ocean and Baltic Sea for grid cells with concentrations <4 mg/l, 4-6 mg/l and >6 mg/l group, for oxygen concentrations in the near-bottom layer during 1989-2021.
Loading