All official European Union website addresses are in the europa.eu domain.
See all EU institutions and bodies
An official website of the European Union | How do you know?
Environmental information systems
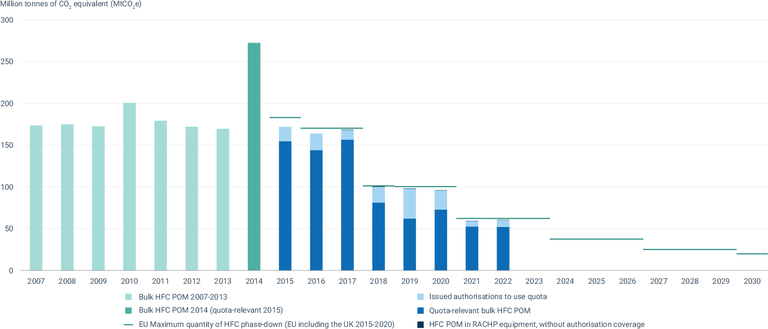
This graph shows the progress of the hydrofluorocarbon (HFC) phase-down under EU regulation. HFC, hydrofluorocarbon; POM, placing on the market; RACHP, refrigeration, air conditioning and heat pump.
Data shown for 2022 are preliminary and subject to further validation by the European Commission. Values from 2007 to 2013 are based on the reporting obligations of the old F-gas Regulation (EC) No 842/2006 and are therefore not fully comparable with data from 2014 onwards (based on the obligations of the current F-gas Regulation (EU) No 517/2014).
The maximum quantities of the EU HFC phase-down shown for 2015-2019 apply to EU-28, for 2020 to EU-27 and UK. EU-27 maximum quantities for 2021 onwards have been recalculated to reflect the effects of Brexit.
Loading