All official European Union website addresses are in the europa.eu domain.
See all EU institutions and bodies
An official website of the European Union | How do you know?
Environmental information systems
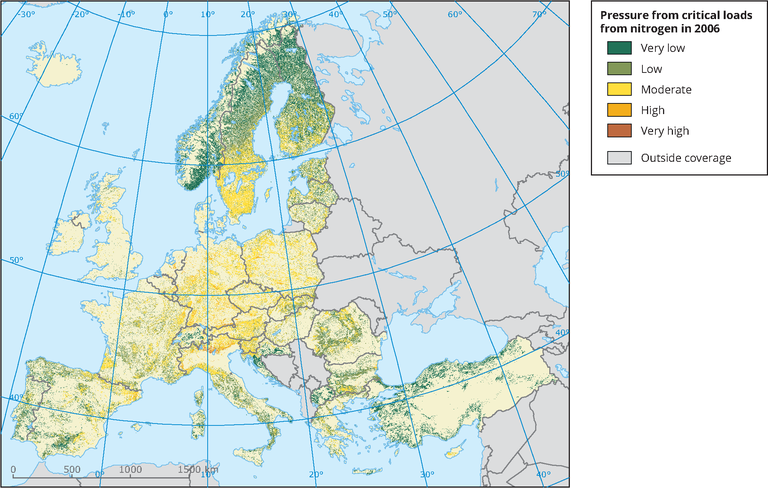
Map of indicator on exceedance of critical loads developed here shows the excess in airborne nitrogen depositions per habitat type (EUNIS levels 2 and 3) on forest ecosystem
Loading