All official European Union website addresses are in the europa.eu domain.
See all EU institutions and bodies
An official website of the European Union | How do you know?
Environmental information systems
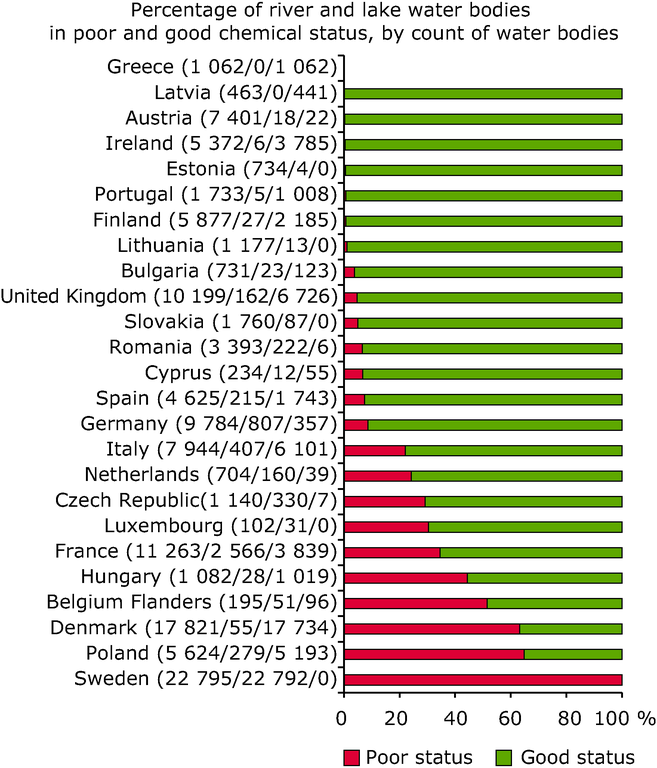
The graphs illustrate the chemical status of river and lake water bodies as percentage of water bodies in poor and good chemical status, by count of water bodies.
Loading