All official European Union website addresses are in the europa.eu domain.
See all EU institutions and bodies
An official website of the European Union | How do you know?
Environmental information systems
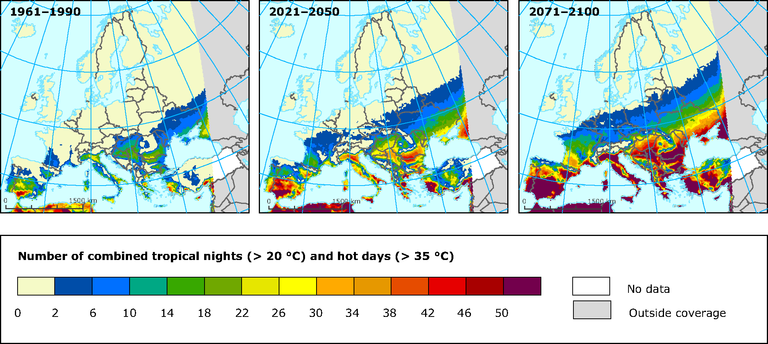
Maps show changes in extreme temperature for two future periods, relative to 1961-1990. Extreme temperatures are represented by the combined number of hot summer (June-August) days (TMAX>35°C) and tropical nights (TMIN>20°C). All projections are the average of 5 Regional Climate Model simulations of the EU-ENSEMBLES project using the IPCC SRES A1B emission scenario for the periods 1961-90, 2021-2050 and 2071-2100 (Fischer and Schär, 2010).
Loading