All official European Union website addresses are in the europa.eu domain.
See all EU institutions and bodies
An official website of the European Union | How do you know?
Environmental information systems
Climate change is happening and we need to get ready for more intense heatwaves, floods and storms, wildfires and water scarcity. Different climate-related hazards affect regions, sectors of the economy and members of society in different ways. Decision-makers need the best data and information to help them understand the imperatives and make the necessary preparations — adapted to the different scenarios and likely consequences, at European, national and sub-national levels. Europe’s changing climate hazards, an interactive index-based EEA report, brings it all together with an overview of past and projected changes in Europe’s most important climate hazards.
Key messages
Climate change due to human activities is now undeniably responsible for an increase in extreme weather events in Europe.
Pronounced regional differences in conditions mean that one-size-fits-all responses are no match for the growing threat that these climate hazards pose to property and lives.
People everywhere need to be prepared for more days with extreme temperatures and for more extreme precipitation events. The Mediterranean region especially should be ready for hotter summers and more frequent droughts.
High-quality, enriched data are crucial to assess who is likely to be affected and how, yet not all EEA member countries have had access to such fine-grained data. Now all European regions do.
The EEA’s tools help European countries to implement their policies on climate change adaptation and disaster risk reduction, under the European Climate Law and the EU Civil Protection Mechanism.
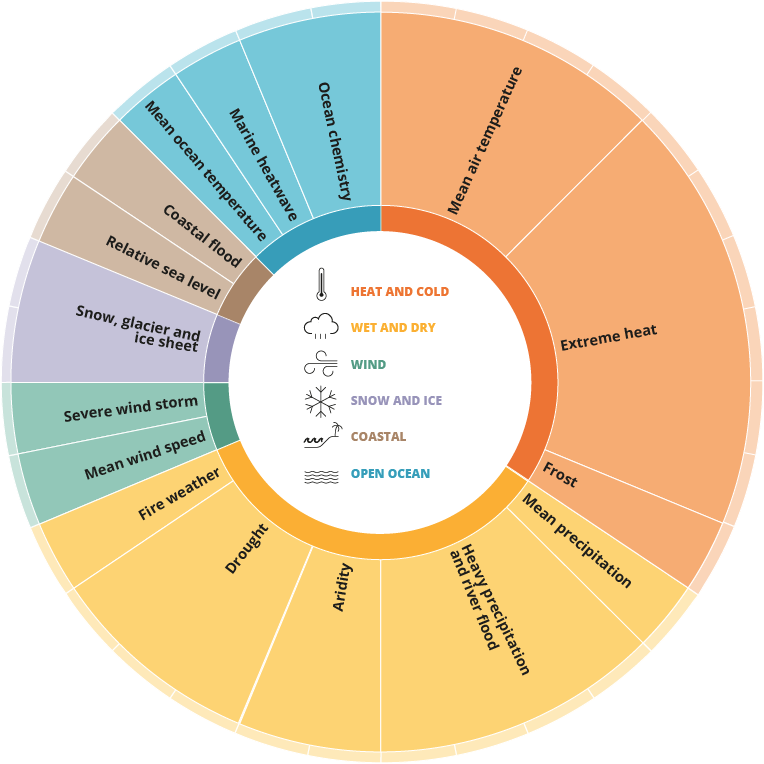
Consult an overview of Europe's 16 hazards with their 32 indices grouped into six hazard types as identified by the Intergovernmental Panel on Climate Change (IPCC) in its Sixth Assessment Report, by clicking on the image:
Features of the EEA’s interactive climate hazards report and related products
Climate hazards are grouped under 32 indices and presented in a highly visual way to help decision-makers understand the challenges they face and prepare for them. The features of the report include:
an index-based overview of past and projected changes in major climate hazards affecting Europe
access to generalised or detailed information according to user needs in the European Climate Data Explorer
insight into how various climate hazards affect different sectors
the ability to zoom in on the data for a region or even a sub-region - for 15 of the 32 indices.
interactive maps to better represent and communicate climate hazards to everyone affected.
Find out how information can help Europe tackle the hazards created by climate change due to human activities.

Consult technical information on the indices: Technical Paper 1/2020 Climate-related hazard indices for Europe by the ETC/CCA.
Consult the European Climate Data Explorer on the EEA’s Climate-ADAPT portal, based on data delivered by Copernicus Climate Change System.
Report no. 15/2021
Title: Europe's changing climate hazards — an index-based interactive EEA report
HTML - TH-AL-21-015-EN-Q- ISBN 978-92-9480-407-5 ISSN 1977-8449 - doi: 10.2800/458052
- Data sources behind the indices presented.
- Acronyms and abbreviations, concepts and definitions
- Learn about indicators on the Climate-ADAPT portal
- Browse an overview of national and transnational climate atlases in Europe