All official European Union website addresses are in the europa.eu domain.
See all EU institutions and bodies
An official website of the European Union | How do you know?
Environmental information systems
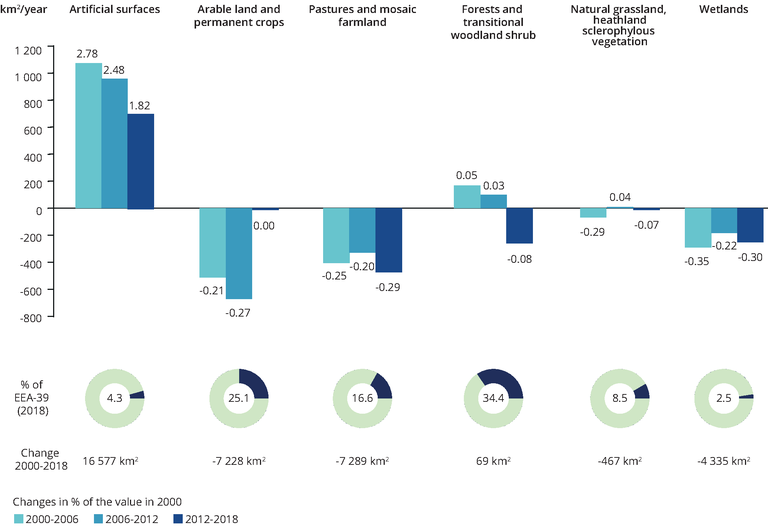
The chart shows the periodical change of land cover classes, expressed in km2 and calculated as a yearly value.