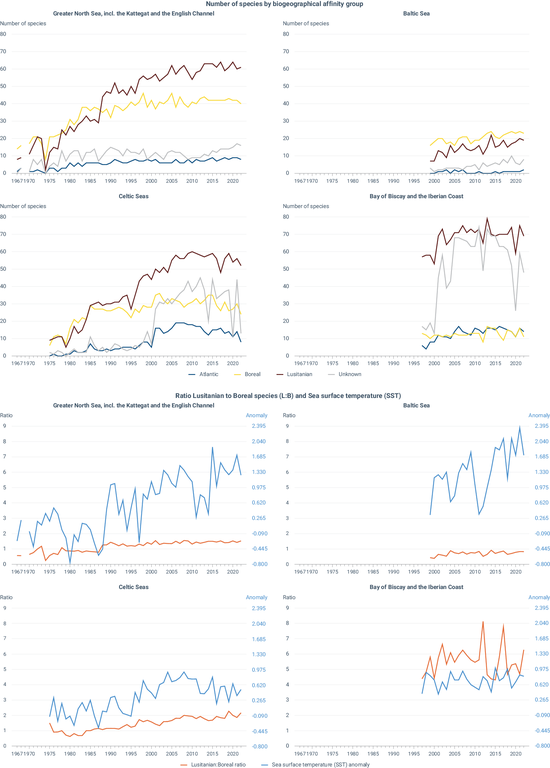
Temporal development of the number of species of each biogeographical affinity group (top) and of the ratio between Lusitanian and Boreal species with sea surface temperature (bottom) by marine region
Chart (static)
The charts show:
Top figures: the temporal development in the number of species of each biogeographical affinity group (Atlantic, Boreal, Lusitania and Unknown) by marine region (Greater North Sea, Baltic Sea, Celtic Seas and Bay of Biscay and the Iberian Coast).
Bottom figures: the temporal development of the ratio between Lusitanian and Boreal species and sea surface temperature by marine region to investigate correlations.
International Council for the Exploration of the Sea (ICES)
Methodology
Database of Trawl Surveys (DATRAS) provided by International Council for the Exploration of the Sea (ICES). Data products (such as Catch per Unit Effort -CPUE- per area or indices) and raw data, can be freely downloaded according to the ICES Data policy.
The Met Office Hadley Centre's sea surface temperature data set, Hadley Centre SST data set (HadSST).4.0.1.0 is a monthly global field of SST on a 5° latitude by 5° longitude grid from 1850 to date. The SST data are taken from release 3.0.0 of the International Comprehensive Ocean-Atmosphere Data Set, ICOADS (external web page), from 1850 to 2014 and from ICOADS release 3.0.1 from 2015 onwards. From January 2016, these are supplemented by drifting buoy observations "Generated using E.U. Copernicus Marine Service Information" from CMEMS (Copernicus Marine Environment Monitoring Service). HadSST.4.0.1.0 is produced by taking in situ measurements of SST from ships and buoys, rejecting measurements that fail quality checks, converting the measurements to anomalies by subtracting climatological values from the measurements, and calculating a robust average of the resulting anomalies on a 5° by 5° degree monthly grid. After gridding the anomalies, bias adjustments are applied to reduce the effects of changes in SST measuring practices. The uncertainties arising from under-sampling and measurement error have been calculated for the gridded monthly data as have the uncertainties on the bias adjustments following the procedures described in the paper.
Kennedy, J. J., Rayner, N. A., Atkinson, C. P., & Killick, R. E. (2019). An ensemble data set of sea‐surface temperature change from 1850: the Met Office Hadley Centre HadSST.4.0.0.0 data set. Journal of Geophysical Research: Atmospheres, 124. https://doi.org/10.1029/2018JD029867
Units
Top figures: number of species Bottom figures: Lusitanian:Boreal ratio and anomaly (auxiliary Y-axis)
Additional information
• The figure shows the number and the ratios of the number of Lusitanian species to the number Boreal species (L:B ratios) observed by year. • It also shows sea surface temperature (SST) anomalies centred and scaled so that SST series and L:B ratios have the same mean and variance, to aid comparison. • Data for 1969 are not displayed as the North Sea International Bottom Trawl Survey (NS-IBTS) survey used theHerring Bottom Trawl 180 feet (H18) herring bottom trawl instead of the Grande Ouverture Verticale (GOV) trawl in that year.
Geographical coverage Marine Strategy Framework Directive (MSFD) sub-regions: Baltic Sea, Bay of Biscay and the Iberian Coast, Celtic Seas, Greater North Sea, and widely distributed