All official European Union website addresses are in the europa.eu domain.
See all EU institutions and bodies
An official website of the European Union | How do you know?
Environmental information systems
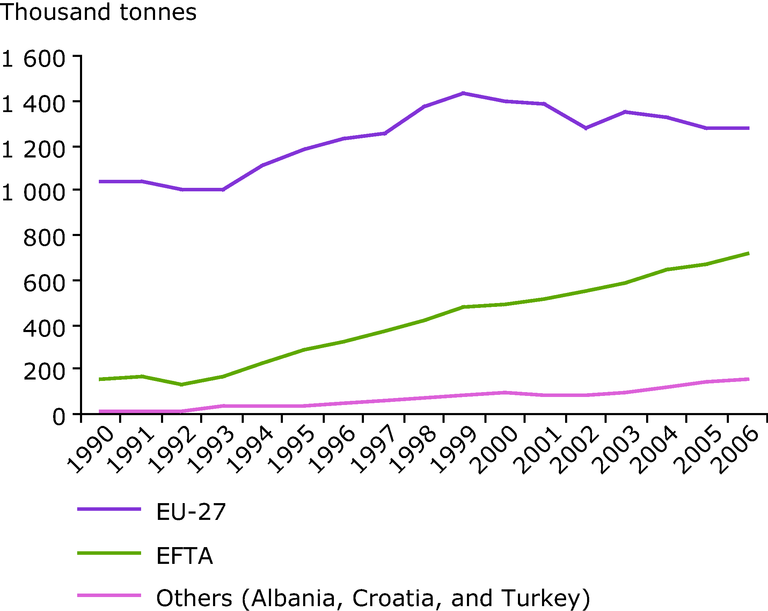
How to read the graph: In EFTA, between 1990 and 2006 the annual aquaculture production increased from 150 000 to 720 000 tonnes
Loading