All official European Union website addresses are in the europa.eu domain.
See all EU institutions and bodies
An official website of the European Union | How do you know?
Environmental information systems
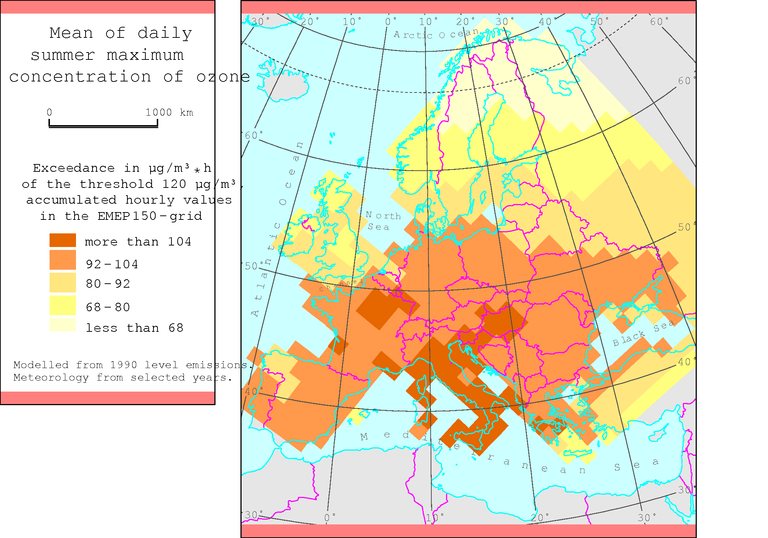
The model indicates a clear gradient over Europe: summertime concentrations ranging from 60 mg/m3 in the northern part to more than 100 mg/m3 in the central part and in the Mediterranean region (1 ppb O3 >> 2 mg/m3).
Loading